


Journal of Computer Applications ›› 2023, Vol. 43 ›› Issue (5): 1385-1393.DOI: 10.11772/j.issn.1001-9081.2022030401
Special Issue: 第九届中国数据挖掘会议(CCDM 2022)
• China Conference on Data Mining 2022 (CCDM 2022) • Previous Articles Next Articles
Xingheng TANG1,2, Qiang GUO1,2( ), Tianhui XU1,2, Caiming ZHANG2,3,4
Received:2022-03-30
Revised:2022-05-18
Accepted:2022-05-30
Online:2023-05-08
Published:2023-05-10
Contact:
Qiang GUO
About author:TANG Xingheng, born in 1998, M. S. candidate. His research interests include data mining, time-series data prediction.Supported by:
汤兴恒1,2, 郭强1,2(), 徐天慧1,2, 张彩明2,3,4
通讯作者:
郭强
作者简介:汤兴恒(1998—),男,山东济宁人,硕士研究生,主要研究方向:数据挖掘、时序数据预测基金资助:CLC Number:
Xingheng TANG, Qiang GUO, Tianhui XU, Caiming ZHANG. Stock return prediction via multi-scale kernel adaptive filtering[J]. Journal of Computer Applications, 2023, 43(5): 1385-1393.
汤兴恒, 郭强, 徐天慧, 张彩明. 基于多尺度核自适应滤波的股票收益预测[J]. 《计算机应用》唯一官方网站, 2023, 43(5): 1385-1393.
Add to citation manager EndNote|Ris|BibTeX
URL: https://www.joca.cn/EN/10.11772/j.issn.1001-9081.2022030401

Fig. 1 Schematic diagram of MSKAF model

Fig. 2 Multi-level stationary wavelet decomposition

Fig. 3 Schematic diagram of outlier detection process
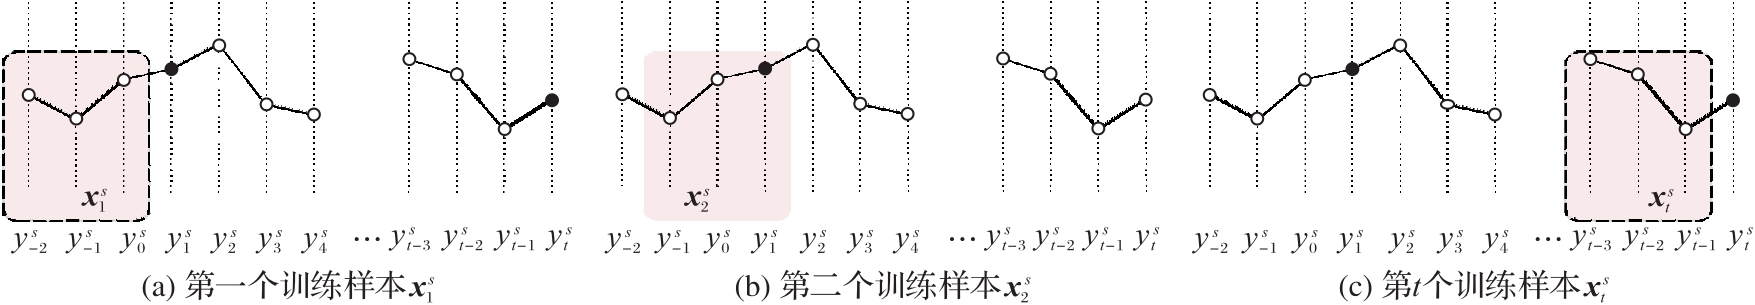
Fig. 4 Sampling process of stock time series

Fig. 5 Multivariate time series data dependence model
| 市场 | 股票代码 | 股票名称 |
|---|---|---|
| DE | ADS | Adidas AG |
| ALV | Allianz SE | |
| DPW | Deutsche Post AG | |
| DTE | Deutsche Telekom AG | |
| HEI | Heidelberg Cement AG | |
| LIN | Linde AG | |
| MRK | Merck KGaA | |
| SAP | SAP AG | |
| UK | ADM | Admiral Group PLC |
| AHT | Ashtead Group PLC | |
| BA | BAE Systems PLC | |
| BP | BP PLC | |
| CCL | Carnival PLC | |
| IAG | International Consolidated Airlines Group | |
| SKY | SKY PLC | |
| VOD | Vodafone Group PLC | |
| US | AAL | American Airlines Group Inc |
| AAPL | Apple Inc | |
| AMZN | Amazon Inc | |
| C | Citigroup Inc | |
| GOOGL | Alphabet In-CL A | |
| MSFT | Microsoft Corp | |
| SPY | SPDR S&P 500 Etf | |
| T | AT&T |
Tab. 1 Stock information used in experimental process
| 市场 | 股票代码 | 股票名称 |
|---|---|---|
| DE | ADS | Adidas AG |
| ALV | Allianz SE | |
| DPW | Deutsche Post AG | |
| DTE | Deutsche Telekom AG | |
| HEI | Heidelberg Cement AG | |
| LIN | Linde AG | |
| MRK | Merck KGaA | |
| SAP | SAP AG | |
| UK | ADM | Admiral Group PLC |
| AHT | Ashtead Group PLC | |
| BA | BAE Systems PLC | |
| BP | BP PLC | |
| CCL | Carnival PLC | |
| IAG | International Consolidated Airlines Group | |
| SKY | SKY PLC | |
| VOD | Vodafone Group PLC | |
| US | AAL | American Airlines Group Inc |
| AAPL | Apple Inc | |
| AMZN | Amazon Inc | |
| C | Citigroup Inc | |
| GOOGL | Alphabet In-CL A | |
| MSFT | Microsoft Corp | |
| SPY | SPDR S&P 500 Etf | |
| T | AT&T |
| 参数 | |||||||
|---|---|---|---|---|---|---|---|
| 时间窗口大小m | |||||||
| 时间窗口滑动步长step | |||||||
| 步长 | |||||||
| 带宽 | |||||||
| 量化值 | |||||||
| 质心距离 | |||||||
| 异常点阈值 | |||||||
| 低频序列异常点阈值 | |||||||
| 高频序列异常点阈值 | |||||||
| 信息量阈值 | |||||||
| 网络层数 | |||||||
| 每层神经元数量 | |||||||
| 最大滞后次数 | |||||||
| 滞后差异数 | |||||||
| 协整秩 | |||||||
| 超参数 | |||||||
| 超参数 |
Tab. 2 Parameter setting of comparison methods
| 参数 | |||||||
|---|---|---|---|---|---|---|---|
| 时间窗口大小m | |||||||
| 时间窗口滑动步长step | |||||||
| 步长 | |||||||
| 带宽 | |||||||
| 量化值 | |||||||
| 质心距离 | |||||||
| 异常点阈值 | |||||||
| 低频序列异常点阈值 | |||||||
| 高频序列异常点阈值 | |||||||
| 信息量阈值 | |||||||
| 网络层数 | |||||||
| 每层神经元数量 | |||||||
| 最大滞后次数 | |||||||
| 滞后差异数 | |||||||
| 协整秩 | |||||||
| 超参数 | |||||||
| 超参数 |
股票 代码 | LSTM | VAR | VECM | NICE-KLMS | QKLMS | TSKAF | 本文 方法 |
|---|---|---|---|---|---|---|---|
| ADS | 0.011 0 | 0.011 5 | 0.013 6 | 0.010 9 | 0.010 9 | 0.013 7 | 0.014 0 |
| ALV | 0.010 0 | 0.010 1 | 0.012 2 | 0.010 1 | 0.010 0 | 0.012 2 | 0.013 2 |
| DPW | 0.061 0 | 0.060 1 | 0.071 1 | 0.060 8 | 0.060 9 | 0.064 5 | 0.064 1 |
| DTE | 0.006 3 | 0.006 5 | 0.007 3 | 0.006 3 | 0.006 3 | 0.014 2 | 0.019 0 |
| HEI | 0.009 7 | 0.010 2 | 0.011 5 | 0.009 7 | 0.009 8 | 0.016 1 | 0.020 2 |
| LIN | 0.007 6 | 0.007 7 | 0.009 3 | 0.007 5 | 0.007 5 | 0.010 0 | 0.011 0 |
| MRK | 0.007 1 | 0.007 3 | 0.008 7 | 0.007 1 | 0.007 1 | 0.011 2 | 0.010 3 |
| SAP | 0.007 2 | 0.007 2 | 0.008 6 | 0.007 8 | 0.007 8 | 0.013 0 | 0.011 5 |
| ADM | 0.008 4 | 0.008 7 | 0.010 5 | 0.008 3 | 0.008 3 | 0.015 4 | 0.012 4 |
| AHT | 0.015 1 | 0.016 2 | 0.019 6 | 0.015 3 | 0.015 2 | 0.021 5 | 0.016 8 |
| BA | 0.009 1 | 0.009 3 | 0.010 6 | 0.008 7 | 0.008 8 | 0.013 4 | 0.016 7 |
| BP | 0.007 6 | 0.007 6 | 0.009 | 0.007 7 | 0.007 7 | 0.019 4 | 0.010 4 |
| CCL | 0.008 1 | 0.008 5 | 0.010 6 | 0.008 2 | 0.008 2 | 0.015 6 | 0.011 2 |
| IAG | 0.021 1 | 0.021 4 | 0.024 6 | 0.021 3 | 0.021 2 | 0.032 2 | 0.025 9 |
| SKY | 0.032 2 | 0.032 5 | 0.039 8 | 0.032 3 | 0.032 2 | 0.039 0 | 0.034 4 |
| VOD | 0.007 1 | 0.007 4 | 0.008 8 | 0.008 3 | 0.008 1 | 0.016 6 | 0.011 3 |
| AAL | 0.013 9 | 0.015 5 | 0.018 1 | 0.014 9 | 0.014 8 | 0.022 8 | 0.016 8 |
| AAPL | 0.008 5 | 0.008 8 | 0.009 5 | 0.008 6 | 0.008 5 | 0.022 4 | 0.026 1 |
| AMZN | 0.009 4 | 0.010 1 | 0.011 5 | 0.010 2 | 0.010 0 | 0.023 2 | 0.027 1 |
| C | 0.008 6 | 0.009 7 | 0.012 3 | 0.009 4 | 0.009 4 | 0.041 7 | 0.019 6 |
| GOOGL | 0.007 9 | 0.008 2 | 0.009 1 | 0.008 2 | 0.008 1 | 0.009 8 | 0.011 1 |
| MSFT | 0.007 6 | 0.007 8 | 0.009 0 | 0.007 4 | 0.007 5 | 0.010 0 | 0.012 1 |
| SPY | 0.003 9 | 0.004 1 | 0.005 0 | 0.003 8 | 0.003 8 | 0.005 7 | 0.006 8 |
| T | 0.008 2 | 0.008 1 | 0.009 6 | 0.008 1 | 0.008 2 | 0.010 5 | 0.011 2 |
| 均值 | 0.012 | 0.013 | 0.015 | 0.013 | 0.013 | 0.020 | 0.018 |
| 标准差 | 0.012 | 0.011 | 0.014 | 0.012 | 0.012 | 0.013 | 0.012 |
Tab. 3 MAE values of different models in test phase
股票 代码 | LSTM | VAR | VECM | NICE-KLMS | QKLMS | TSKAF | 本文 方法 |
|---|---|---|---|---|---|---|---|
| ADS | 0.011 0 | 0.011 5 | 0.013 6 | 0.010 9 | 0.010 9 | 0.013 7 | 0.014 0 |
| ALV | 0.010 0 | 0.010 1 | 0.012 2 | 0.010 1 | 0.010 0 | 0.012 2 | 0.013 2 |
| DPW | 0.061 0 | 0.060 1 | 0.071 1 | 0.060 8 | 0.060 9 | 0.064 5 | 0.064 1 |
| DTE | 0.006 3 | 0.006 5 | 0.007 3 | 0.006 3 | 0.006 3 | 0.014 2 | 0.019 0 |
| HEI | 0.009 7 | 0.010 2 | 0.011 5 | 0.009 7 | 0.009 8 | 0.016 1 | 0.020 2 |
| LIN | 0.007 6 | 0.007 7 | 0.009 3 | 0.007 5 | 0.007 5 | 0.010 0 | 0.011 0 |
| MRK | 0.007 1 | 0.007 3 | 0.008 7 | 0.007 1 | 0.007 1 | 0.011 2 | 0.010 3 |
| SAP | 0.007 2 | 0.007 2 | 0.008 6 | 0.007 8 | 0.007 8 | 0.013 0 | 0.011 5 |
| ADM | 0.008 4 | 0.008 7 | 0.010 5 | 0.008 3 | 0.008 3 | 0.015 4 | 0.012 4 |
| AHT | 0.015 1 | 0.016 2 | 0.019 6 | 0.015 3 | 0.015 2 | 0.021 5 | 0.016 8 |
| BA | 0.009 1 | 0.009 3 | 0.010 6 | 0.008 7 | 0.008 8 | 0.013 4 | 0.016 7 |
| BP | 0.007 6 | 0.007 6 | 0.009 | 0.007 7 | 0.007 7 | 0.019 4 | 0.010 4 |
| CCL | 0.008 1 | 0.008 5 | 0.010 6 | 0.008 2 | 0.008 2 | 0.015 6 | 0.011 2 |
| IAG | 0.021 1 | 0.021 4 | 0.024 6 | 0.021 3 | 0.021 2 | 0.032 2 | 0.025 9 |
| SKY | 0.032 2 | 0.032 5 | 0.039 8 | 0.032 3 | 0.032 2 | 0.039 0 | 0.034 4 |
| VOD | 0.007 1 | 0.007 4 | 0.008 8 | 0.008 3 | 0.008 1 | 0.016 6 | 0.011 3 |
| AAL | 0.013 9 | 0.015 5 | 0.018 1 | 0.014 9 | 0.014 8 | 0.022 8 | 0.016 8 |
| AAPL | 0.008 5 | 0.008 8 | 0.009 5 | 0.008 6 | 0.008 5 | 0.022 4 | 0.026 1 |
| AMZN | 0.009 4 | 0.010 1 | 0.011 5 | 0.010 2 | 0.010 0 | 0.023 2 | 0.027 1 |
| C | 0.008 6 | 0.009 7 | 0.012 3 | 0.009 4 | 0.009 4 | 0.041 7 | 0.019 6 |
| GOOGL | 0.007 9 | 0.008 2 | 0.009 1 | 0.008 2 | 0.008 1 | 0.009 8 | 0.011 1 |
| MSFT | 0.007 6 | 0.007 8 | 0.009 0 | 0.007 4 | 0.007 5 | 0.010 0 | 0.012 1 |
| SPY | 0.003 9 | 0.004 1 | 0.005 0 | 0.003 8 | 0.003 8 | 0.005 7 | 0.006 8 |
| T | 0.008 2 | 0.008 1 | 0.009 6 | 0.008 1 | 0.008 2 | 0.010 5 | 0.011 2 |
| 均值 | 0.012 | 0.013 | 0.015 | 0.013 | 0.013 | 0.020 | 0.018 |
| 标准差 | 0.012 | 0.011 | 0.014 | 0.012 | 0.012 | 0.013 | 0.012 |
股票 代码 | LSTM | VAR | VECM | NICE-KLMS | QKLMS | TSKAF | 本文 方法 |
|---|---|---|---|---|---|---|---|
| ADS | 0.000 3 | 0.000 3 | 0.000 4 | 0.000 3 | 0.000 3 | 0.000 4 | 0.000 4 |
| ALV | 0.000 3 | 0.000 3 | 0.000 3 | 0.000 3 | 0.000 3 | 0.000 3 | 0.000 4 |
| DPW | 0.013 4 | 0.013 4 | 0.017 2 | 0.013 5 | 0.013 2 | 0.014 0 | 0.013 8 |
| DTE | 0.000 1 | 0.000 1 | 0.000 1 | 0.000 1 | 0.000 1 | 0.000 3 | 0.000 3 |
| HEI | 0.000 2 | 0.000 2 | 0.000 2 | 0.000 2 | 0.000 2 | 0.000 4 | 0.000 4 |
| LIN | 0.000 1 | 0.000 1 | 0.000 1 | 0.000 1 | 0.000 1 | 0.000 2 | 0.000 2 |
| MRK | 0.000 1 | 0.000 1 | 0.000 2 | 0.000 1 | 0.000 1 | 0.000 2 | 0.000 2 |
| SAP | 0.000 1 | 0.000 1 | 0.000 1 | 0.000 1 | 0.000 1 | 0.000 3 | 0.000 2 |
| ADM | 0.000 2 | 0.000 2 | 0.000 2 | 0.000 2 | 0.000 2 | 0.000 4 | 0.000 3 |
| AHT | 0.000 5 | 0.000 5 | 0.000 7 | 0.000 5 | 0.000 5 | 0.000 8 | 0.000 6 |
| BA | 0.000 2 | 0.000 2 | 0.000 2 | 0.000 2 | 0.000 2 | 0.000 3 | 0.000 4 |
| BP | 0.000 1 | 0.000 1 | 0.000 1 | 0.000 1 | 0.000 1 | 0.000 5 | 0.000 2 |
| CCL | 0.000 1 | 0.000 1 | 0.000 2 | 0.000 1 | 0.000 1 | 0.000 4 | 0.000 2 |
| IAG | 0.000 9 | 0.000 9 | 0.001 1 | 0.000 9 | 0.000 9 | 0.001 6 | 0.001 2 |
| SKY | 0.002 8 | 0.002 8 | 0.003 7 | 0.002 8 | 0.002 8 | 0.003 4 | 0.003 0 |
| VOD | 0.000 1 | 0.000 1 | 0.000 2 | 0.000 1 | 0.000 1 | 0.000 4 | 0.000 2 |
| AAL | 0.000 4 | 0.000 4 | 0.000 5 | 0.000 4 | 0.000 4 | 0.000 8 | 0.000 5 |
| AAPL | 0.000 2 | 0.000 2 | 0.000 2 | 0.000 2 | 0.000 2 | 0.000 6 | 0.000 6 |
| AMZN | 0.000 2 | 0.000 2 | 0.000 3 | 0.000 2 | 0.000 2 | 0.000 7 | 0.000 6 |
| C | 0.000 1 | 0.000 2 | 0.000 2 | 0.000 2 | 0.000 2 | 0.001 9 | 0.000 5 |
| GOOGL | 0.000 1 | 0.000 1 | 0.000 2 | 0.000 1 | 0.000 1 | 0.000 2 | 0.000 2 |
| MSFT | 0.000 1 | 0.000 1 | 0.000 2 | 0.000 1 | 0.000 1 | 0.000 2 | 0.000 2 |
| SPY | 0.000 0 | 0.000 0 | 0.000 1 | 0.000 0 | 0.000 0 | 0.000 1 | 0.000 1 |
| T | 0.000 1 | 0.000 1 | 0.000 2 | 0.000 1 | 0.000 1 | 0.000 2 | 0.000 2 |
| 均值 | 0.001 | 0.001 | 0.001 | 0.001 | 0.001 | 0.001 | 0.001 |
| 标准差 | 0.003 | 0.003 | 0.004 | 0.003 | 0.003 | 0.003 | 0.003 |
Tab. 4 MSE values of different models in test phase
股票 代码 | LSTM | VAR | VECM | NICE-KLMS | QKLMS | TSKAF | 本文 方法 |
|---|---|---|---|---|---|---|---|
| ADS | 0.000 3 | 0.000 3 | 0.000 4 | 0.000 3 | 0.000 3 | 0.000 4 | 0.000 4 |
| ALV | 0.000 3 | 0.000 3 | 0.000 3 | 0.000 3 | 0.000 3 | 0.000 3 | 0.000 4 |
| DPW | 0.013 4 | 0.013 4 | 0.017 2 | 0.013 5 | 0.013 2 | 0.014 0 | 0.013 8 |
| DTE | 0.000 1 | 0.000 1 | 0.000 1 | 0.000 1 | 0.000 1 | 0.000 3 | 0.000 3 |
| HEI | 0.000 2 | 0.000 2 | 0.000 2 | 0.000 2 | 0.000 2 | 0.000 4 | 0.000 4 |
| LIN | 0.000 1 | 0.000 1 | 0.000 1 | 0.000 1 | 0.000 1 | 0.000 2 | 0.000 2 |
| MRK | 0.000 1 | 0.000 1 | 0.000 2 | 0.000 1 | 0.000 1 | 0.000 2 | 0.000 2 |
| SAP | 0.000 1 | 0.000 1 | 0.000 1 | 0.000 1 | 0.000 1 | 0.000 3 | 0.000 2 |
| ADM | 0.000 2 | 0.000 2 | 0.000 2 | 0.000 2 | 0.000 2 | 0.000 4 | 0.000 3 |
| AHT | 0.000 5 | 0.000 5 | 0.000 7 | 0.000 5 | 0.000 5 | 0.000 8 | 0.000 6 |
| BA | 0.000 2 | 0.000 2 | 0.000 2 | 0.000 2 | 0.000 2 | 0.000 3 | 0.000 4 |
| BP | 0.000 1 | 0.000 1 | 0.000 1 | 0.000 1 | 0.000 1 | 0.000 5 | 0.000 2 |
| CCL | 0.000 1 | 0.000 1 | 0.000 2 | 0.000 1 | 0.000 1 | 0.000 4 | 0.000 2 |
| IAG | 0.000 9 | 0.000 9 | 0.001 1 | 0.000 9 | 0.000 9 | 0.001 6 | 0.001 2 |
| SKY | 0.002 8 | 0.002 8 | 0.003 7 | 0.002 8 | 0.002 8 | 0.003 4 | 0.003 0 |
| VOD | 0.000 1 | 0.000 1 | 0.000 2 | 0.000 1 | 0.000 1 | 0.000 4 | 0.000 2 |
| AAL | 0.000 4 | 0.000 4 | 0.000 5 | 0.000 4 | 0.000 4 | 0.000 8 | 0.000 5 |
| AAPL | 0.000 2 | 0.000 2 | 0.000 2 | 0.000 2 | 0.000 2 | 0.000 6 | 0.000 6 |
| AMZN | 0.000 2 | 0.000 2 | 0.000 3 | 0.000 2 | 0.000 2 | 0.000 7 | 0.000 6 |
| C | 0.000 1 | 0.000 2 | 0.000 2 | 0.000 2 | 0.000 2 | 0.001 9 | 0.000 5 |
| GOOGL | 0.000 1 | 0.000 1 | 0.000 2 | 0.000 1 | 0.000 1 | 0.000 2 | 0.000 2 |
| MSFT | 0.000 1 | 0.000 1 | 0.000 2 | 0.000 1 | 0.000 1 | 0.000 2 | 0.000 2 |
| SPY | 0.000 0 | 0.000 0 | 0.000 1 | 0.000 0 | 0.000 0 | 0.000 1 | 0.000 1 |
| T | 0.000 1 | 0.000 1 | 0.000 2 | 0.000 1 | 0.000 1 | 0.000 2 | 0.000 2 |
| 均值 | 0.001 | 0.001 | 0.001 | 0.001 | 0.001 | 0.001 | 0.001 |
| 标准差 | 0.003 | 0.003 | 0.004 | 0.003 | 0.003 | 0.003 | 0.003 |
| 股票代码 | LSTM | VAR | VECM | NICE-KLMS | QKLMS | TSKAF | 本文方法 |
|---|---|---|---|---|---|---|---|
| ADS | 0.901 7 | 2.268 2 | 0.936 9 | 0.216 2 | 0.005 1 | 3.651 7 | 4.240 6 |
| ALV | 1.296 5 | 1.081 7 | 0.002 1 | 0.208 9 | 0.072 9 | 3.392 1 | 4.770 8 |
| DPW | -0.752 2 | -0.871 7 | 0.794 8 | -1.002 7 | -1.118 7 | 2.126 2 | -0.183 0 |
| DTE | 0.268 8 | 0.766 5 | 1.257 1 | -0.037 2 | -0.123 6 | 1.946 3 | 5.290 4 |
| HEI | 0.857 4 | 1.390 8 | 2.007 7 | 0.208 9 | -0.028 7 | 2.005 1 | 5.726 7 |
| LIN | 0.504 4 | 1.262 3 | 2.507 4 | 0.112 6 | 0.064 6 | 3.122 8 | 4.678 0 |
| MRK | 0.729 6 | 1.465 5 | 0.675 6 | 0.098 3 | -0.025 7 | 3.620 5 | 4.125 8 |
| SAP | 0.740 5 | 1.860 4 | 2.480 6 | 0.049 7 | -0.037 1 | 4.382 1 | 5.416 0 |
| ADM | 0.466 3 | 2.432 6 | 1.016 4 | 0.334 0 | 0.006 5 | 5.951 0 | 6.663 2 |
| AHT | 2.279 4 | -1.324 6 | -0.377 8 | 0.936 0 | -1.204 8 | 5.361 4 | 2.932 4 |
| BA | 0.724 6 | 1.209 7 | 1.265 6 | 0.099 8 | -0.057 9 | 2.195 2 | 5.177 1 |
| BP | 1.036 1 | -0.027 5 | -1.303 4 | 1.564 5 | 0.109 4 | 6.537 3 | 5.540 4 |
| CCL | 1.243 3 | -0.743 5 | -0.515 4 | 0.545 6 | 0.021 6 | 5.976 4 | 6.126 7 |
| IAG | 1.919 3 | 0.366 2 | -1.349 7 | -1.123 0 | 1.566 2 | 4.557 0 | -0.644 6 |
| SKY | -0.246 9 | -1.289 8 | -1.333 4 | 0.363 7 | 0.318 0 | 1.424 8 | 0.749 3 |
| VOD | 0.695 5 | 0.389 1 | 1.422 7 | 0.222 0 | 0.168 8 | 5.249 1 | 6.593 1 |
| AAL | 1.131 9 | -1.144 0 | -1.161 6 | -0.577 4 | 0.494 6 | 5.882 0 | 3.847 8 |
| AAPL | 0.643 2 | 1.042 2 | 1.648 0 | 0.127 9 | -0.127 4 | 2.664 4 | 5.001 1 |
| AMZN | 0.593 4 | 1.032 7 | 1.730 7 | 0.168 1 | -0.020 5 | 1.549 9 | 3.922 9 |
| C | 0.975 0 | 1.655 6 | -0.303 1 | 0.273 7 | 0.087 9 | 3.655 5 | -2.387 9 |
| GOOGL | 0.511 8 | 1.333 4 | 1.283 5 | 0.118 5 | 0.045 9 | 2.971 0 | 4.546 8 |
| MSFT | 0.529 1 | 1.226 8 | 2.110 7 | 0.130 1 | 0.035 5 | 2.888 1 | 4.535 2 |
| SPY | 0.412 1 | 1.071 1 | 1.725 9 | 0.082 7 | -0.097 7 | 1.784 6 | 3.073 8 |
| T | 1.294 7 | 1.368 1 | 1.182 8 | 0.143 8 | -0.068 4 | 3.339 6 | 4.072 6 |
| 均值 | 0.770 | 0.722 | 0.738 | 0.136 | 0.004 | 3.593 | 3.909 |
| 标准差 | 0.606 | 1.061 | 1.207 | 0.517 | 0.484 | 1.562 | 2.319 |
Tab. 5 SR values of different models in test phase
| 股票代码 | LSTM | VAR | VECM | NICE-KLMS | QKLMS | TSKAF | 本文方法 |
|---|---|---|---|---|---|---|---|
| ADS | 0.901 7 | 2.268 2 | 0.936 9 | 0.216 2 | 0.005 1 | 3.651 7 | 4.240 6 |
| ALV | 1.296 5 | 1.081 7 | 0.002 1 | 0.208 9 | 0.072 9 | 3.392 1 | 4.770 8 |
| DPW | -0.752 2 | -0.871 7 | 0.794 8 | -1.002 7 | -1.118 7 | 2.126 2 | -0.183 0 |
| DTE | 0.268 8 | 0.766 5 | 1.257 1 | -0.037 2 | -0.123 6 | 1.946 3 | 5.290 4 |
| HEI | 0.857 4 | 1.390 8 | 2.007 7 | 0.208 9 | -0.028 7 | 2.005 1 | 5.726 7 |
| LIN | 0.504 4 | 1.262 3 | 2.507 4 | 0.112 6 | 0.064 6 | 3.122 8 | 4.678 0 |
| MRK | 0.729 6 | 1.465 5 | 0.675 6 | 0.098 3 | -0.025 7 | 3.620 5 | 4.125 8 |
| SAP | 0.740 5 | 1.860 4 | 2.480 6 | 0.049 7 | -0.037 1 | 4.382 1 | 5.416 0 |
| ADM | 0.466 3 | 2.432 6 | 1.016 4 | 0.334 0 | 0.006 5 | 5.951 0 | 6.663 2 |
| AHT | 2.279 4 | -1.324 6 | -0.377 8 | 0.936 0 | -1.204 8 | 5.361 4 | 2.932 4 |
| BA | 0.724 6 | 1.209 7 | 1.265 6 | 0.099 8 | -0.057 9 | 2.195 2 | 5.177 1 |
| BP | 1.036 1 | -0.027 5 | -1.303 4 | 1.564 5 | 0.109 4 | 6.537 3 | 5.540 4 |
| CCL | 1.243 3 | -0.743 5 | -0.515 4 | 0.545 6 | 0.021 6 | 5.976 4 | 6.126 7 |
| IAG | 1.919 3 | 0.366 2 | -1.349 7 | -1.123 0 | 1.566 2 | 4.557 0 | -0.644 6 |
| SKY | -0.246 9 | -1.289 8 | -1.333 4 | 0.363 7 | 0.318 0 | 1.424 8 | 0.749 3 |
| VOD | 0.695 5 | 0.389 1 | 1.422 7 | 0.222 0 | 0.168 8 | 5.249 1 | 6.593 1 |
| AAL | 1.131 9 | -1.144 0 | -1.161 6 | -0.577 4 | 0.494 6 | 5.882 0 | 3.847 8 |
| AAPL | 0.643 2 | 1.042 2 | 1.648 0 | 0.127 9 | -0.127 4 | 2.664 4 | 5.001 1 |
| AMZN | 0.593 4 | 1.032 7 | 1.730 7 | 0.168 1 | -0.020 5 | 1.549 9 | 3.922 9 |
| C | 0.975 0 | 1.655 6 | -0.303 1 | 0.273 7 | 0.087 9 | 3.655 5 | -2.387 9 |
| GOOGL | 0.511 8 | 1.333 4 | 1.283 5 | 0.118 5 | 0.045 9 | 2.971 0 | 4.546 8 |
| MSFT | 0.529 1 | 1.226 8 | 2.110 7 | 0.130 1 | 0.035 5 | 2.888 1 | 4.535 2 |
| SPY | 0.412 1 | 1.071 1 | 1.725 9 | 0.082 7 | -0.097 7 | 1.784 6 | 3.073 8 |
| T | 1.294 7 | 1.368 1 | 1.182 8 | 0.143 8 | -0.068 4 | 3.339 6 | 4.072 6 |
| 均值 | 0.770 | 0.722 | 0.738 | 0.136 | 0.004 | 3.593 | 3.909 |
| 标准差 | 0.606 | 1.061 | 1.207 | 0.517 | 0.484 | 1.562 | 2.319 |
| 分解层数k | SR |
|---|---|
| 1 | 2.019 |
| 2 | 3.909 |
| 3 | 0.305 |
Tab. 6 Influence of multi-scale decomposition layers on experimental results
| 分解层数k | SR |
|---|---|
| 1 | 2.019 |
| 2 | 3.909 |
| 3 | 0.305 |

Fig. 6 Influence of m and step on experimental results
| 1 | OH K J, KIM K J. Analyzing stock market tick data using piecewise nonlinear model[J]. Expert Systems with Applications, 2002, 22(3): 249-255. 10.1016/s0957-4174(01)00058-6 |
| 2 | ARIYO A A, ADEWUMI A O, AYO C K. Stock price prediction using the ARIMA model[C]// Proceedings of the UKSim-AMSS 16th International Conference on Computer Modelling and Simulation. Piscataway: IEEE, 2014: 106-112. 10.1109/uksim.2014.67 |
| 3 | TSAY R S. Analysis of Financial Time Series[M]. Hoboken, NJ: John Wiley & Sons, Inc., 2005: 134-135. 10.1002/0471746193 |
| 4 | FISCHER T, KRAUSS C. Deep learning with long short-term memory networks for financial market predictions[J]. European Journal of Operational Research, 2018, 270(2): 654-669. 10.1016/j.ejor.2017.11.054 |
| 5 | GARCIA-VEGA S, ZENG X J, KEANE J. Stock returns prediction using kernel adaptive filtering within a stock market interdependence approach[J]. Expert Systems with Applications, 2020, 160: No.113668. 10.1016/j.eswa.2020.113668 |
| 6 | ADAM K, MARCET A, NICOLINI J P. Stock market volatility and learning[J]. The Journal of Finance, 2016, 71(1): 33-82. 10.1111/jofi.12364 |
| 7 | 谭绮君. 基于多尺度分解和LSTM网络的金融时间序列预测研究[D]. 广州:华南理工大学, 2020: 1-8. |
| TAN Q J. Financial time series prediction based on multiscale decomposition and long short-term memory networks[D]. Guangzhou: South China University of Technology, 2020: 1-8. | |
| 8 | ZHANG L H, AGGARWAL C, QI G J. Stock price prediction via discovering multi-frequency trading patterns[C]// Proceedings of the 23rd ACM SIGKDD International Conference on Knowledge Discovery and Data Mining. New York: ACM, 2017: 2141-2149. 10.1145/3097983.3098117 |
| 9 | REJEB A B, ARFAOUI M. Financial market interdependencies: a quantile regression analysis of volatility spillover[J]. Research in International Business and Finance, 2016, 36: 140-157. 10.1016/j.ribaf.2015.09.022 |
| 10 | SIMS C A. Macroeconomics and reality[J]. Econometrica, 1980, 48(1): 1-48. 10.2307/1912017 |
| 11 | SIMS C A. Comparison of interwar and postwar business cycles: monetarism reconsidered[J]. The American Economic Review, 1980, 70(2): 250-257. |
| 12 | ENGLE R F, GRANGER C W J. Co-integration and error correction: Representation, estimation, and testing[J]. Econometrica, 1987, 55(2): 251-276. 10.2307/1913236 |
| 13 | VALENTE J M, MALDONADO S. SVR-FFS: a novel forward feature selection approach for high-frequency time series forecasting using support vector regression[J]. Expert Systems with Applications, 2020, 160: No.113729. 10.1016/j.eswa.2020.113729 |
| 14 | 韩敏,马俊珠,任伟杰,等. 基于核自适应滤波器的时间序列在线预测研究综述[J]. 自动化学报, 2021, 47(4): 730-746. |
| HAN M, MA J Z, REN W J, et al. A survey of time series online prediction based on kernel adaptive filters[J]. Acta Automatica Sinica, 2021, 47(4): 730-746. | |
| 15 | LIU W F, POKHAREL P P, PRINCIPE J C. The kernel least-mean-square algorithm[J]. IEEE Transactions on Signal Processing, 2008, 56(2): 543-554. 10.1109/tsp.2007.907881 |
| 16 | CHEN B D, ZHAO S L, ZHU P P, et al. Quantized kernel least mean square algorithm[J]. IEEE Transactions on Neural Networks and Learning Systems, 2012, 23(1): 22-32. 10.1109/tnnls.2011.2178446 |
| 17 | LI K, PRINCIPE J C. Transfer learning in adaptive filters: the nearest instance centroid-estimation kernel least-mean-square algorithm[J]. IEEE Transactions on Signal Processing, 2017, 65(24): 6520-6535. 10.1109/tsp.2017.2752695 |
| 18 | SEZER O B, GUDELEK M U, OZBAYOGLU A M. Financial time series forecasting with deep learning: a systematic literature review: 2005-2019[J]. Applied Soft Computing, 2020, 90: No.106181. 10.1016/j.asoc.2020.106181 |
| 19 | 赵洪科,吴李康,李徵,等. 基于深度神经网络结构的互联网金融市场动态预测[J]. 计算机研究与发展, 2019, 56(8): 1621-1631. 10.7544/issn1000-1239.2019.20190330 |
| ZHAO H K, WU L K, LI Z, et al. Predicting the dynamics in Internet finance based on deep neural network structure[J]. Journal of Computer Research and Development, 2019, 56(8): 1621-1631. 10.7544/issn1000-1239.2019.20190330 | |
| 20 | 杜圣东,李天瑞,杨燕,等. 一种基于序列到序列时空注意力学习的交通流预测模型[J]. 计算机研究与发展, 2020, 57(8): 1715-1728. 10.7544/issn1000-1239.2020.20200169 |
| DU S D, LI T R, YANG Y, et al. A sequence-to-sequence spatial-temporal attention learning model for urban traffic flow prediction[J]. Journal of Computer Research and Development, 2020, 57(8): 1715-1728. 10.7544/issn1000-1239.2020.20200169 | |
| 21 | MESHRAM S G, GHORBANI M A, SHAMSHIRBAND S, et al. River flow prediction using hybrid PSOGSA algorithm based on feed-forward neural network[J]. Soft Computing, 2019, 23(20): 10429-10438. 10.1007/s00500-018-3598-7 |
| 22 | RATHER A M, AGARWAL A, SASTRY V N. Recurrent neural network and a hybrid model for prediction of stock returns[J]. Expert Systems with Applications, 2015, 42(6): 3234-3241. 10.1016/j.eswa.2014.12.003 |
| 23 | HOCHREITER S, SCHMIDHUBER J. Long short-term memory[J]. Neural Computation, 1997, 9(8): 1735-1780. 10.1162/neco.1997.9.8.1735 |
| 24 | YAMANISHI K, TAKEUCHI J. A unifying framework for detecting outliers and change points from non-stationary time series data[C]// Proceedings of the 8th ACM SIGKDD International Conference on Knowledge Discovery and Data Mining. New York: ACM, 2002: 676-681. 10.1145/775047.775148 |
| 25 | TAKEUCHI J, YAMANISHI K. A unifying framework for detecting outliers and change points from time series[J]. IEEE Transactions on Knowledge and Data Engineering, 2006, 18(4): 482-492. 10.1109/tkde.2006.1599387 |
| 26 | SCHÖLKOPF B, SMOLA A J. Learning with Kernels: Support Vector Machines, Regularization, Optimization, and Beyond[M]. Cambridge: MIT Press, 2002: 25-48. |
| 27 | SIIKANEN M, BALTAKYS K, KANNIAINEN J, et al. Facebook drives behavior of passive households in stock markets[J]. Finance Research Letters, 2018, 27: 208-213. 10.1016/j.frl.2018.03.020 |
| 28 | LÜTKEPOHL H. Vector autoregressive models[M]// HASHIMZADE N, THORNTON M. Handbook of Research Methods and Applications in Empirical Macroeconomics. Northampton, MA: Edward Elgar Publishing, 2013: 139-164. 10.4337/9780857931023 |
| 29 | KUO C Y. Does the vector error correction model perform better than others in forecasting stock price? an application of residual income valuation theory[J]. Economic Modelling, 2016, 52(Pt B): 772-789. 10.1016/j.econmod.2015.10.016 |
| 30 | BAEK Y, KIM H Y. ModAugNet: a new forecasting framework for stock market index value with an overfitting prevention LSTM module and a prediction LSTM module[J]. Expert Systems with Applications, 2018, 113: 457-480. 10.1016/j.eswa.2018.07.019 |
| 31 | KIRAN R, KUMAR P, BHASKER B. DNNRec: a novel deep learning based hybrid recommender system[J]. Expert Systems with Applications, 2020, 144: No.113054. 10.1016/j.eswa.2019.113054 |
| 32 | WANG W Y, LI W Z, ZHANG N, et al. Portfolio formation with preselection using deep learning from long-term financial data[J]. Expert Systems with Applications, 2020, 143: No.113042. 10.1016/j.eswa.2019.113042 |
| 33 | CUI Y W, AHMAD S, HAWKINS J. Continuous online sequence learning with an unsupervised neural network model[J]. Neural Computation, 2016, 28(11): 2474-2504. 10.1162/neco_a_00893 |
| 34 | LIU W F, PRINCIPE J C, HAYKIN S. Kernel Adaptive Filtering: A Comprehensive Introduction[M]. Hoboken, NJ: John Wiley & Sons, Inc., 2010: 34-37. 10.1002/9780470608593 |
| [1] | XU Yan, XIONG Yingjun, YANG Jing. Review of spike sequence learning methods for spiking neurons [J]. Journal of Computer Applications, 2018, 38(6): 1527-1534. |
| Viewed | ||||||
|
Full text |
|
|||||
|
Abstract |
|
|||||