


Journal of Computer Applications ›› 2024, Vol. 44 ›› Issue (4): 1099-1106.DOI: 10.11772/j.issn.1001-9081.2023050557
Special Issue: 人工智能
• Artificial intelligence • Previous Articles Next Articles
Zongyu LI1,2, Siwei QIANG3, Xiaobo GUO3, Zhenfeng ZHU1,2( )
)
Received:2023-05-10
Revised:2023-07-18
Accepted:2023-07-24
Online:2023-08-03
Published:2024-04-10
Contact:
Zhenfeng ZHU
About author:LI Zongyu, born in 1998, M. S. candidate. His research interests include causal effect estimation, causal inference.Supported by:
李宗禹1,2, 强思维3, 郭晓波3, 朱振峰1,2()
通讯作者:
朱振峰
作者简介:李宗禹(1998—),男,河北衡水人,硕士研究生,主要研究方向:因果效应估计、因果推理基金资助:CLC Number:
Zongyu LI, Siwei QIANG, Xiaobo GUO, Zhenfeng ZHU. Re-weighted adversarial variational autoencoder and its application in industrial causal effect estimation[J]. Journal of Computer Applications, 2024, 44(4): 1099-1106.
李宗禹, 强思维, 郭晓波, 朱振峰. 重加权的对抗变分自编码器及其在工业因果效应估计中的应用[J]. 《计算机应用》唯一官方网站, 2024, 44(4): 1099-1106.
Add to citation manager EndNote|Ris|BibTeX
URL: https://www.joca.cn/EN/10.11772/j.issn.1001-9081.2023050557
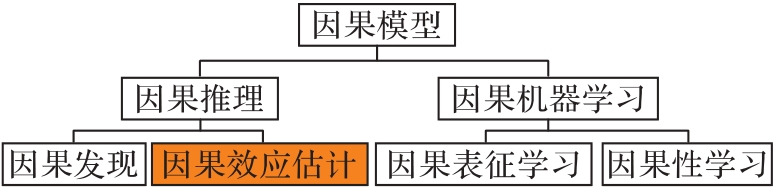
Fig. 1 Taxonomy of causal models
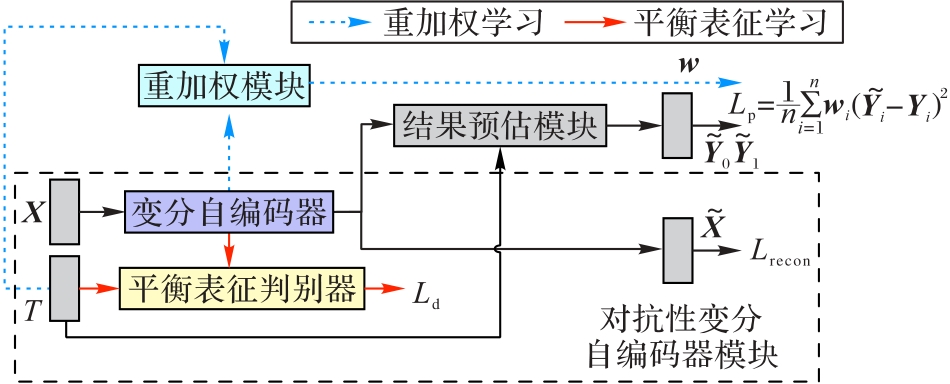
Fig. 2 Overall structure of RVAENet
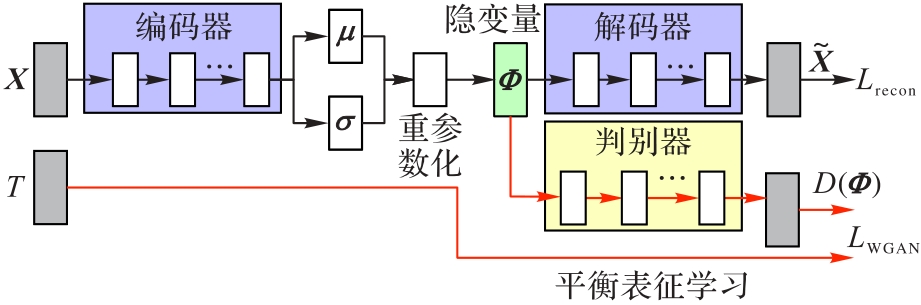
Fig. 3 Framework of adversarial VAE
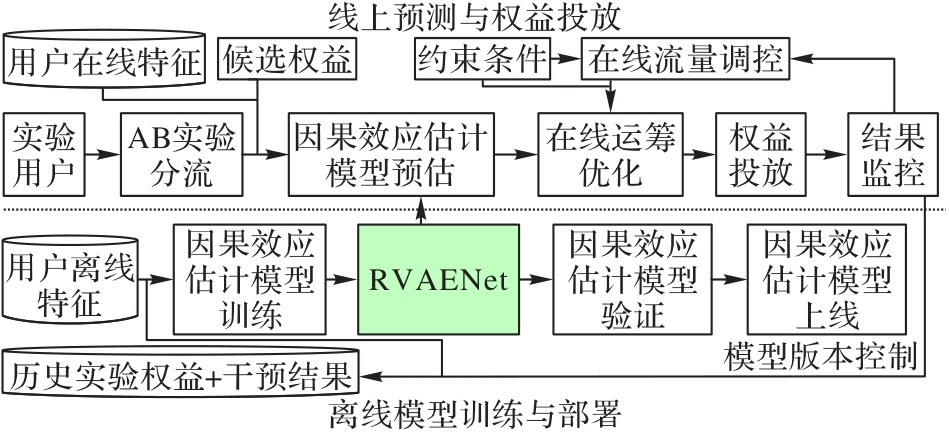
Fig. 4 Framework and flow of benefit recommendation system
| 模型 | 测试集AUUC | |
|---|---|---|
| 场景1 | 场景2 | |
| SRF[ | 0.355 3 | 0.321 8 |
| TRF[ | 0.253 1 | 0.061 9 |
| TARNet[ | 0.384 4 | 0.346 6 |
| CFRNet[ | 0.384 8 | 0.346 9 |
| WCFR[ | 0.433 1 | 0.391 5 |
| DragonNet[ | 0.384 4 | 0.348 7 |
| GANITE[ | 0.363 4 | 0.377 6 |
| CEVAE[ | 0.426 7 | 0.367 6 |
| TEDVAE[ | 0.427 3 | 0.383 8 |
| RVAENet | 0.491 5 | 0.445 3 |
Tab. 1 Performance of causal effect estimation on industrial dataset of recommended system
| 模型 | 测试集AUUC | |
|---|---|---|
| 场景1 | 场景2 | |
| SRF[ | 0.355 3 | 0.321 8 |
| TRF[ | 0.253 1 | 0.061 9 |
| TARNet[ | 0.384 4 | 0.346 6 |
| CFRNet[ | 0.384 8 | 0.346 9 |
| WCFR[ | 0.433 1 | 0.391 5 |
| DragonNet[ | 0.384 4 | 0.348 7 |
| GANITE[ | 0.363 4 | 0.377 6 |
| CEVAE[ | 0.426 7 | 0.367 6 |
| TEDVAE[ | 0.427 3 | 0.383 8 |
| RVAENet | 0.491 5 | 0.445 3 |
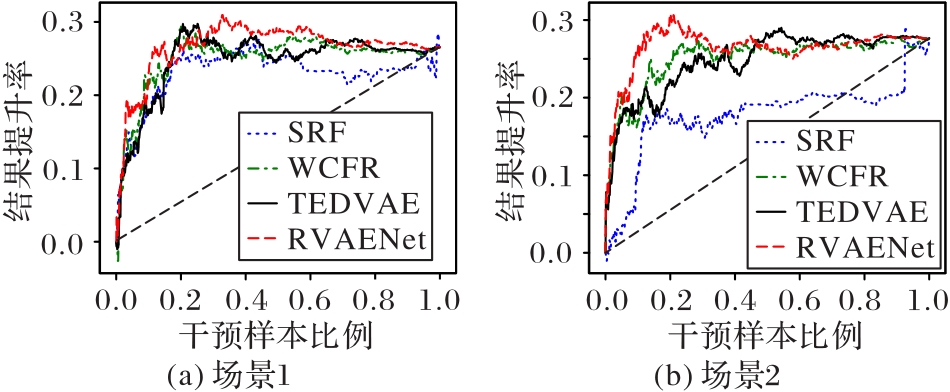
Fig. 5 Response lift curves of various models under Scenario 1 and 2
| 模型 | ||||||
|---|---|---|---|---|---|---|
| IHDP(In-sample) | IHDP(Out-sample) | Twins(In-sample) | Twins(Out-sample) | Jobs(In-sample) | Jobs(Out-sample) | |
| BNN | 2.20±0.10 | 2.10±0.10 | 0.307±0.001 | 0.309±0.004 | 0.20±0.01 | 0.24±0.02 |
| TARNet | 0.88±0.02 | 0.95±0.02 | 0.314±0.001 | 0.313±0.002 | 0.17±0.01 | 0.21±0.01 |
| CFRMMD | 0.73±0.01 | 0.78±0.02 | 0.312±0.001 | 0.316±0.003 | 0.18±0.00 | 0.21±0.01 |
| CFRWASS | 0.71±0.02 | 0.76±0.02 | 0.308±0.001 | 0.309±0.003 | 0.17±0.01 | 0.21±0.01 |
| CEVAE | 2.70±0.10 | 2.60±0.10 | 0.289±0.005 | 0.297±0.016 | 0.15±0.00 | 0.26±0.00 |
| GANITE | 1.90±0.40 | 2.40±0.40 | — | — | 0.13±0.01 | 0.14±0.01 |
| SITE | 0.60±0.09 | 0.66±0.11 | 0.309±0.002 | 0.311±0.004 | 0.22±0.00 | 0.22±0.01 |
| ACE | 0.49±0.05 | 0.54±0.06 | 0.306±0.000 | 0.301±0.002 | 0.22±0.01 | 0.22±0.01 |
| DKLITE | 0.52±0.02 | 0.65±0.03 | 0.288±0.001 | 0.293±0.003 | 0.13±0.01 | 0.14±0.01 |
| DeR-CFR | 0.44±0.02 | 0.53±0.07 | — | — | 0.19±0.04 | 0.21±0.06 |
| NESTER | 0.73±0.19 | 0.76±0.20 | 0.318±0.002 | 0.319±0.000 | — | — |
| CBRE | 0.52±0.00 | 0.60±0.10 | — | — | 0.13±0.00 | 0.28±0.00 |
| CITE | 0.58±0.10 | 0.60±0.10 | — | — | 0.23±0.02 | 0.88±0.00 |
| RVAENet | 0.45±0.04 | 0.51±0.03 | 0.291±0.002 | 0.293±0.001 | 0.13±0.01 | 0.14±0.00 |
Tab. 2 Performance of individual treatment effect estimation on publication datasets
| 模型 | ||||||
|---|---|---|---|---|---|---|
| IHDP(In-sample) | IHDP(Out-sample) | Twins(In-sample) | Twins(Out-sample) | Jobs(In-sample) | Jobs(Out-sample) | |
| BNN | 2.20±0.10 | 2.10±0.10 | 0.307±0.001 | 0.309±0.004 | 0.20±0.01 | 0.24±0.02 |
| TARNet | 0.88±0.02 | 0.95±0.02 | 0.314±0.001 | 0.313±0.002 | 0.17±0.01 | 0.21±0.01 |
| CFRMMD | 0.73±0.01 | 0.78±0.02 | 0.312±0.001 | 0.316±0.003 | 0.18±0.00 | 0.21±0.01 |
| CFRWASS | 0.71±0.02 | 0.76±0.02 | 0.308±0.001 | 0.309±0.003 | 0.17±0.01 | 0.21±0.01 |
| CEVAE | 2.70±0.10 | 2.60±0.10 | 0.289±0.005 | 0.297±0.016 | 0.15±0.00 | 0.26±0.00 |
| GANITE | 1.90±0.40 | 2.40±0.40 | — | — | 0.13±0.01 | 0.14±0.01 |
| SITE | 0.60±0.09 | 0.66±0.11 | 0.309±0.002 | 0.311±0.004 | 0.22±0.00 | 0.22±0.01 |
| ACE | 0.49±0.05 | 0.54±0.06 | 0.306±0.000 | 0.301±0.002 | 0.22±0.01 | 0.22±0.01 |
| DKLITE | 0.52±0.02 | 0.65±0.03 | 0.288±0.001 | 0.293±0.003 | 0.13±0.01 | 0.14±0.01 |
| DeR-CFR | 0.44±0.02 | 0.53±0.07 | — | — | 0.19±0.04 | 0.21±0.06 |
| NESTER | 0.73±0.19 | 0.76±0.20 | 0.318±0.002 | 0.319±0.000 | — | — |
| CBRE | 0.52±0.00 | 0.60±0.10 | — | — | 0.13±0.00 | 0.28±0.00 |
| CITE | 0.58±0.10 | 0.60±0.10 | — | — | 0.23±0.02 | 0.88±0.00 |
| RVAENet | 0.45±0.04 | 0.51±0.03 | 0.291±0.002 | 0.293±0.001 | 0.13±0.01 | 0.14±0.00 |
| 模型 | ||||||
|---|---|---|---|---|---|---|
| IHDP(In-sample) | IHDP(Out-sample) | Twins(In-sample) | Twins(Out-sample) | Jobs(In-sample) | Jobs(Out-sample) | |
| BNN | 0.37±0.03 | 0.42±0.03 | 0.006±0.003 | 0.020±0.007 | 0.04±0.01 | 0.09±0.04 |
| TARNet | 0.26±0.01 | 0.28±0.01 | 0.011±0.002 | 0.015±0.002 | 0.05±0.02 | 0.11±0.04 |
| CFRMMD | 0.30±0.01 | 0.31±0.01 | — | 0.04±0.01 | 0.08±0.03 | |
| CFRWASS | 0.25±0.01 | 0.27±0.01 | 0.011±0.002 | 0.028±0.003 | 0.02±0.01 | 0.09±0.03 |
| CEVAE | 0.34±0.01 | 0.46±0.02 | — | — | 0.02±0.01 | 0.03±0.01 |
| GANITE | 0.43±0.05 | 0.49±0.05 | 0.006±0.002 | 0.009±0.008 | 0.01±0.01 | 0.06±0.03 |
| DeR-CFR | 0.13±0.02 | 0.15±0.02 | — | — | 0.05±0.08 | 0.09±0.03 |
| NESTER | 0.06±0.04 | 0.09±0.07 | 0.003±0.003 | 0.063±0.003 | 0.06±0.00 | 0.02±0.01 |
| CBRE | 0.10±0.01 | 0.13±0.02 | — | — | 0.10±0.03 | 0.21±0.07 |
| CITE | 0.09±0.01 | 0.11±0.02 | — | — | 0.06±0.02 | 0.07±0.03 |
| RVAENet | 0.07±0.05 | 0.08±0.06 | 0.002±0.001 | 0.006±0.001 | 0.02±0.02 | 0.01±0.01 |
Tab. 3 Performance of average treatment effect estimation on publication datasets
| 模型 | ||||||
|---|---|---|---|---|---|---|
| IHDP(In-sample) | IHDP(Out-sample) | Twins(In-sample) | Twins(Out-sample) | Jobs(In-sample) | Jobs(Out-sample) | |
| BNN | 0.37±0.03 | 0.42±0.03 | 0.006±0.003 | 0.020±0.007 | 0.04±0.01 | 0.09±0.04 |
| TARNet | 0.26±0.01 | 0.28±0.01 | 0.011±0.002 | 0.015±0.002 | 0.05±0.02 | 0.11±0.04 |
| CFRMMD | 0.30±0.01 | 0.31±0.01 | — | 0.04±0.01 | 0.08±0.03 | |
| CFRWASS | 0.25±0.01 | 0.27±0.01 | 0.011±0.002 | 0.028±0.003 | 0.02±0.01 | 0.09±0.03 |
| CEVAE | 0.34±0.01 | 0.46±0.02 | — | — | 0.02±0.01 | 0.03±0.01 |
| GANITE | 0.43±0.05 | 0.49±0.05 | 0.006±0.002 | 0.009±0.008 | 0.01±0.01 | 0.06±0.03 |
| DeR-CFR | 0.13±0.02 | 0.15±0.02 | — | — | 0.05±0.08 | 0.09±0.03 |
| NESTER | 0.06±0.04 | 0.09±0.07 | 0.003±0.003 | 0.063±0.003 | 0.06±0.00 | 0.02±0.01 |
| CBRE | 0.10±0.01 | 0.13±0.02 | — | — | 0.10±0.03 | 0.21±0.07 |
| CITE | 0.09±0.01 | 0.11±0.02 | — | — | 0.06±0.02 | 0.07±0.03 |
| RVAENet | 0.07±0.05 | 0.08±0.06 | 0.002±0.001 | 0.006±0.001 | 0.02±0.02 | 0.01±0.01 |
| 消融网络 | ||||||
|---|---|---|---|---|---|---|
| IHDP(In-sample) | IHDP(Out-sample) | Jobs(In-sample) | Jobs(Out-sample) | Twins(In-sample) | Twins(Out-sample) | |
| AENet | 0.51±0.03 | 0.54±0.02 | 0.16±0.04 | 0.20±0.02 | 0.315±0.008 | 0.320±0.006 |
| VAENet | 0.49±0.05 | 0.52±0.03 | 0.15±0.02 | 0.15±0.03 | 0.301±0.001 | 0.303±0.002 |
| IPWNet | 0.53±0.04 | 0.59±0.03 | 0.17±0.03 | 0.19±0.02 | 0.306±0.007 | 0.308±0.005 |
| AIPWNet | 0.52±0.05 | 0.56±0.02 | 0.16±0.04 | 0.17±0.04 | 0.305±0.003 | 0.306±0.004 |
| CBPSNet | 0.54±0.03 | 0.57±0.04 | 0.16±0.04 | 0.18±0.04 | 0.312±0.007 | 0.313±0.009 |
| RVAENet | 0.45±0.04 | 0.51±0.03 | 0.13±0.01 | 0.14±0.00 | 0.291±0.002 | 0.293±0.001 |
Tab. 4 Quantitative evaluation of modularized causal effect estimation
| 消融网络 | ||||||
|---|---|---|---|---|---|---|
| IHDP(In-sample) | IHDP(Out-sample) | Jobs(In-sample) | Jobs(Out-sample) | Twins(In-sample) | Twins(Out-sample) | |
| AENet | 0.51±0.03 | 0.54±0.02 | 0.16±0.04 | 0.20±0.02 | 0.315±0.008 | 0.320±0.006 |
| VAENet | 0.49±0.05 | 0.52±0.03 | 0.15±0.02 | 0.15±0.03 | 0.301±0.001 | 0.303±0.002 |
| IPWNet | 0.53±0.04 | 0.59±0.03 | 0.17±0.03 | 0.19±0.02 | 0.306±0.007 | 0.308±0.005 |
| AIPWNet | 0.52±0.05 | 0.56±0.02 | 0.16±0.04 | 0.17±0.04 | 0.305±0.003 | 0.306±0.004 |
| CBPSNet | 0.54±0.03 | 0.57±0.04 | 0.16±0.04 | 0.18±0.04 | 0.312±0.007 | 0.313±0.009 |
| RVAENet | 0.45±0.04 | 0.51±0.03 | 0.13±0.01 | 0.14±0.00 | 0.291±0.002 | 0.293±0.001 |
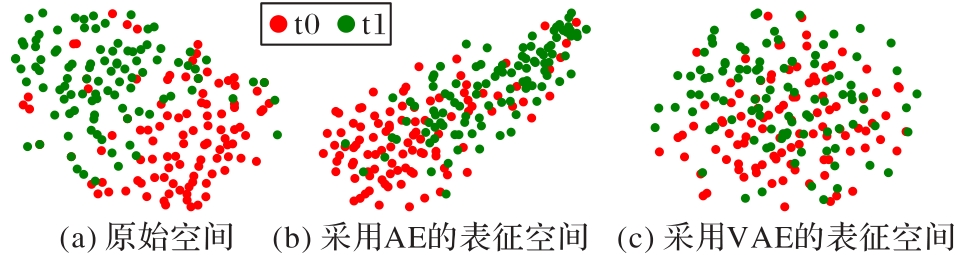
Fig. 6 Visualization comparison of embedding space distribution between AE and VAE on IHDP dataset
| IHDP(In-sample) | IHDP(Out-sample) | Jobs(In-sample) | Jobs(Out-sample) | Twins(In-sample) | Twins(Out-sample) | |||
|---|---|---|---|---|---|---|---|---|
| 5 | 1 | 1 | 0.47±0.05 | 0.52±0.04 | 0.15±0.01 | 0.14±0.01 | 0.302±0.005 | 0.314±0.008 |
| 5 | 1 | 2 | 0.51±0.03 | 0.56±0.02 | 0.13±0.03 | 0.14±0.02 | 0.291±0.002 | 0.293±0.001 |
| 5 | 2 | 1 | 0.52±0.05 | 0.57±0.02 | 0.16±0.02 | 0.15±0.02 | 0.302±0.007 | 0.309±0.005 |
| 10 | 1 | 1 | 0.45±0.04 | 0.51±0.03 | 0.15±0.02 | 0.16±0.01 | 0.305±0.006 | 0.310±0.003 |
| 10 | 1 | 2 | 0.48±0.06 | 0.53±0.05 | 0.14±0.02 | 0.15±0.03 | 0.296±0.004 | 0.297±0.004 |
| 10 | 2 | 1 | 0.46±0.03 | 0.54±0.03 | 0.13±0.01 | 0.14±0.00 | 0.299±0.004 | 0.303±0.006 |
Tab. 5 Quantitative evaluation of causal effect estimation for parameterized adjustment
| IHDP(In-sample) | IHDP(Out-sample) | Jobs(In-sample) | Jobs(Out-sample) | Twins(In-sample) | Twins(Out-sample) | |||
|---|---|---|---|---|---|---|---|---|
| 5 | 1 | 1 | 0.47±0.05 | 0.52±0.04 | 0.15±0.01 | 0.14±0.01 | 0.302±0.005 | 0.314±0.008 |
| 5 | 1 | 2 | 0.51±0.03 | 0.56±0.02 | 0.13±0.03 | 0.14±0.02 | 0.291±0.002 | 0.293±0.001 |
| 5 | 2 | 1 | 0.52±0.05 | 0.57±0.02 | 0.16±0.02 | 0.15±0.02 | 0.302±0.007 | 0.309±0.005 |
| 10 | 1 | 1 | 0.45±0.04 | 0.51±0.03 | 0.15±0.02 | 0.16±0.01 | 0.305±0.006 | 0.310±0.003 |
| 10 | 1 | 2 | 0.48±0.06 | 0.53±0.05 | 0.14±0.02 | 0.15±0.03 | 0.296±0.004 | 0.297±0.004 |
| 10 | 2 | 1 | 0.46±0.03 | 0.54±0.03 | 0.13±0.01 | 0.14±0.00 | 0.299±0.004 | 0.303±0.006 |

Fig. 7 Evolution curve of objective function of network training
| 1 | FONG C, HAZLETT C, IMAI K. Covariate balancing propensity score for a continuous treatment: application to the efficacy of political advertisements[J]. The Annals of Applied Statistics, 2018, 12(1): 156-177. 10.1214/17-aoas1101 |
| 2 | LADA A, PEYSAKHOVICH A, APARICIO D, et al. Observational data for heterogeneous treatment effects with application to recommender systems[C]// Proceedings of the 2019 ACM Conference on Economics and Computation. New York: ACM, 2019: 199-213. 10.1145/3328526.3329558 |
| 3 | SHALIT U. Can we learn individual-level treatment policies from clinical data?[J]. Biostatistics, 2020, 21(2): 359-362. |
| 4 | NIU Y, TANG K, ZHANG H, et al. Counterfactual VQA: a cause-effect look at language bias[C]// Proceedings of the 2021 IEEE/CVF Conference on Computer Vision and Pattern Recognition. Piscataway: IEEE, 2021: 12700-12710. 10.1109/cvpr46437.2021.01251 |
| 5 | ZHAO S, HEFFERNAN N. Estimating individual treatment effect from educational studies with residual counterfactual networks[C]// Proceedings of the 10th International Conference on Educational Data Mining. [S.l.]: International Educational Data Mining Society, 2017: 306-311. |
| 6 | YAO L, CHU Z, LI S, et al. A survey on causal inference[J]. ACM Transactions on Knowledge Discovery from Data, 2021, 15(5): No. 74. 10.1145/3444944 |
| 7 | RUBIN D B. Estimating causal effects of treatments in randomized and nonrandomized studies[J]. Journal of Educational Psychology, 1974, 66(5): 688-701. 10.1037/h0037350 |
| 8 | LI Z, ZHU Z, GUO X, et al. A survey of deep causal models and their industrial applications[J/OL]. Research Square [2023-05-01]. . |
| 9 | JOHANSSON F D, SHALIT U, SONTAG D. Learning representations for counterfactual inference[C]// Proceedings of the 33rd International Conference on Machine Learning. New York: JMLR.org, 2016: 3020-3029. |
| 10 | SHALIT U, JOHANSSON F D, SONTAG D. Estimating individual treatment effect: generalization bounds and algorithms[C]// Proceedings of the 34th International Conference on Machine Learning. New York: JMLR.org, 2017: 3076-3085. 10.1007/978-1-4899-7687-1_328 |
| 11 | HASSANPOUR N, GREINER R. Counterfactual regression with importance sampling weights[C]// Proceedings of the 28th International Joint Conference on Artificial Intelligence. California: ijcai.org, 2019: 5880-5887. 10.24963/ijcai.2019/815 |
| 12 | SHI C, BLEI D M, VEITCH V. Adapting neural networks for the estimation of treatment effects[C]// Proceedings of the 33rd International Conference on Neural Information Processing Systems. Red Hook: Curran Associates Inc., 2019: 2507-2517. |
| 13 | YAO L, LI S, LI Y, et al. Representation learning for treatment effect estimation from observational data[C]// Proceedings of the 32nd International Conference on Neural Information Processing Systems. Red Hook: Curran Associates Inc., 2018: 2638-2648. 10.1109/icdm.2019.00186 |
| 14 | YAO L, LI S, LI Y, et al. ACE: adaptively similarity-preserved representation learning for individual treatment effect estimation[C]// Proceedings of the 2019 IEEE International Conference on Data Mining. Piscataway: IEEE, 2019: 1432-1437. 10.1109/icdm.2019.00186 |
| 15 | ZHANG Y, BELLOT A, VAN DER SCHAAR M. Learning overlapping representations for the estimation of individualized treatment effects[C]// Proceedings of the 23rd International Conference on Artificial Intelligence and Statistics. New York: PMLR, 2020, 108: 1005-1014. |
| 16 | LI X, YAO L. Contrastive individual treatment effects estimation[C]// Proceedings of the 2022 IEEE International Conference on Data Mining. Piscataway: IEEE, 2022: 1053-1058. 10.1109/icdm54844.2022.00130 |
| 17 | LOUIZOS C, SHALIT U, MOOIJ J M, et al. Causal effect inference with deep latent-variable models[C]// Proceedings of the 31st International Conference on Neural Information Processing Systems. Red Hook: Curran Associates Inc., 2017: 6449-6459. |
| 18 | ZHANG W, LIU L, LI J. Treatment effect estimation with disentangled latent factors[J]. Proceedings of the AAAI Conference on Artificial Intelligence, 2021, 35(12): 10923-10930. 10.1609/aaai.v35i12.17304 |
| 19 | WU A, YUAN J, KUANG K, et al. Learning decomposed representations for treatment effect estimation[J]. IEEE Transactions on Knowledge and Data Engineering, 2023, 35(5): 4989-5001. |
| 20 | YOON J, JORDON J, VAN DER SCHAAR M. GANITE: estimation of individualized treatment effects using generative adversarial nets[C/OL]// Proceedings of the 2018 International Conference on Learning Representations [2023-05-01]. . |
| 21 | ZHOU G, YAO L, XU X, et al. Cycle-balanced representation learning for counterfactual inference[C]// Proceedings of the 2022 SIAM International Conference on Data Mining. Philadelphia: SIAM, 2022: 442-450. 10.1137/1.9781611977172.50 |
| 22 | REDDY A G, BALASUBRAMANIAN V N. Estimating treatment effects using neurosymbolic program synthesis[EB/OL]. [2023-05-01]. . |
| 23 | ZHANG W, LI J, LIU L. A unified survey of treatment effect heterogeneity modelling and uplift modelling[J]. ACM Computing Surveys, 2021, 54(8): No. 162. 10.1145/3466818 |
| 24 | KUNZEL S R, SEKHON J S, BICKEL P J, et al. Metalearners for estimating heterogeneous treatment effects using machine learning[J]. Physical Sciences, 2019, 116(10): 4156-4165. 10.1073/pnas.1804597116 |
| 25 | ZHU F, LU J, LIN A, et al. Direct learning with multi-task neural networks for treatment effect estimation[J]. IEEE Transactions on Knowledge and Data Engineering, 2023, 35: 2457-2470. |
| 26 | ROSENBAUM P R, RUBIN D B. The central role of the propensity score in observational studies for causal effects[J]. Biometrika, 1983, 70(1): 41-55. 10.1093/biomet/70.1.41 |
| 27 | ROSENBAUM P R. Model-based direct adjustment[J]. Journal of the American statistical Association, 1987, 82(398): 387-394. 10.1080/01621459.1987.10478441 |
| 28 | ROBINS J M, ROTNITZKY A, ZHAO L P. Estimation of regression coefficients when some regressors are not always observed[J]. Journal of the American Statistical Association, 1994, 89(427): 846-866. 10.1080/01621459.1994.10476818 |
| 29 | IMAI K, RATKOVIC M. Covariate balancing propensity score[J]. Journal of the Royal Statistical Society Series B: Statistical Methodology, 2014, 76(1): 243-263. 10.1111/rssb.12027 |
| 30 | DEVRIENDT F, MOLDOVAN D, VERBEKE W. A literature survey and experimental evaluation of the state-of-the-art in uplift modeling: a stepping stone toward the development of prescriptive analytics[J]. Big Data, 2018, 6(1): 13-41. 10.1089/big.2017.0104 |
| 31 | BROOKS-GUNN J, LIAW F R, KLEBANOV P K. Effects of early intervention on cognitive function of low birth weight preterm infants[J]. The Journal of Pediatrics, 1992, 120(3): 350-359. 10.1016/s0022-3476(05)80896-0 |
| 32 | LaLONDE R J. Evaluating the econometric evaluations of training programs with experimental data[J]. The American Economic Review, 1986, 76: 604-620. |
| 33 | ALMOND D, CHAY K Y, LEE D S. The costs of low birth weight[J]. The Quarterly Journal of Economics, 2005, 120(3): 1031-1083. 10.1162/003355305774268228 |
| [1] | Qing JIA, Laihua WANG, Weisheng WANG. Anomaly detection in video via independently recurrent neural network and variational autoencoder network [J]. Journal of Computer Applications, 2023, 43(2): 507-513. |
| [2] | Qianzhou CAI, Bochuan ZHENG, Xiangyin ZENG, Jin HOU. Wildlife object detection combined with solving method of long-tail data [J]. Journal of Computer Applications, 2022, 42(4): 1284-1291. |
| [3] | Xiancong CHEN, Weike PAN, Zhong MING. Staged variational autoencoder for heterogeneous one-class collaborative filtering [J]. Journal of Computer Applications, 2021, 41(12): 3499-3507. |
| [4] | HUANG Xiaoxiang, HU Yongmei, WU Dan, REN Lijie. Early identification and prediction of abnormal carotid arteries based on variational autoencoder [J]. Journal of Computer Applications, 2021, 41(10): 3082-3088. |
| Viewed | ||||||
|
Full text |
|
|||||
|
Abstract |
|
|||||