


《计算机应用》唯一官方网站 ›› 2024, Vol. 44 ›› Issue (11): 3449-3458.DOI: 10.11772/j.issn.1001-9081.2024030398
李志杰1, 廖旭红1( ), 李元香2, 李青蓝3
收稿日期:2024-04-08
修回日期:2024-06-28
接受日期:2024-07-12
发布日期:2024-08-05
出版日期:2024-11-10
通讯作者:
廖旭红
作者简介:李志杰(1964—),男,湖南永兴人,副教授,博士,CCF会员,主要研究方向:计算生物学、数据挖掘基金资助:
Zhijie LI1, Xuhong LIAO1(), Yuanxiang LI2, Qinglan LI3
Received:2024-04-08
Revised:2024-06-28
Accepted:2024-07-12
Online:2024-08-05
Published:2024-11-10
Contact:
Xuhong LIAO
About author:LI Zhijie, born in 1964, Ph. D., associate professor. His research interests include computational biology, data mining.Supported by:摘要:
基因表达数据作为生物学中一种特定类型的大数据,尽管基因表达值都是普通的实数值,但它们的相似性不是基于欧氏距离度量,而是基于基因表达值是否展现同升同降趋势。目前的基因贝叶斯网络以基因表达水平值为节点随机变量,没有体现这种子空间模式的相似性。因此,提出基于基因关联分析的贝叶斯网络疾病分类算法(BCGA),从带类标签的疾病样本-基因表达数据中学习贝叶斯网络并预测新疾病样本的分类。首先,将疾病样本离散化过滤以选择基因,并将降维后的基因表达值排序和置换为基因列下标;其次,分解基因列下标序列为长度为2的原子序列集合,而这个集合的频繁原子序列对应一对基因的关联关系;最后,通过基因关联熵度量因果关系,并用于贝叶斯网络结构学习。BCGA的参数学习也变得很容易,基因节点的条件概率分布只要统计该基因的原子序列和父节点基因的原子序列出现频次即可。在多个肿瘤和非肿瘤基因表达数据集上的实验结果表明,相较于已有的同类算法,BCGA的疾病分类准确率明显提高,分析时间有效缩短;另外,BCGA使用基因关联熵代替条件独立性,使用基因原子序列代替基因表达值,可以更好地拟合基因表达数据。
中图分类号:
李志杰, 廖旭红, 李元香, 李青蓝. 基于基因关联分析的贝叶斯网络疾病样本分类算法[J]. 计算机应用, 2024, 44(11): 3449-3458.
Zhijie LI, Xuhong LIAO, Yuanxiang LI, Qinglan LI. Disease sample classification algorithm by Bayesian network with gene association analysis[J]. Journal of Computer Applications, 2024, 44(11): 3449-3458.
| 样本 | g1 | g2 | g3 | g4 | g5 | g6 |
|---|---|---|---|---|---|---|
| s1(-) | 0.155 | 0.076 | 0.284 | 0.097 | 0.013 | 0.023 |
| s2(-) | 0.217 | 0.084 | 0.409 | 0.138 | -0.159 | 0.129 |
| s3(-) | 0.375 | 0.115 | -0.201 | 0.254 | -0.094 | -0.181 |
| s4(-) | 0.238 | 0.000 | 0.150 | 0.165 | -0.191 | 0.132 |
| s5(-) | -0.073 | -0.146 | 0.442 | -0.077 | -0.341 | 0.063 |
| s6(-) | 0.394 | 0.909 | 0.443 | 0.818 | 1.070 | 0.227 |
| s7(+) | 0.385 | 0.822 | 0.426 | 0.768 | 1.013 | 0.226 |
| s8(+) | 0.329 | 0.690 | 0.244 | 0.550 | 0.790 | 0.327 |
| s9(+) | 0.384 | 0.730 | 0.066 | 0.529 | 0.852 | 0.313 |
| s10(+) | -0.316 | -0.191 | 0.202 | -0.140 | 0.043 | 0.076 |
表1 疾病基因表达数据示例
Tab. 1 Examples of disease gene expression data
| 样本 | g1 | g2 | g3 | g4 | g5 | g6 |
|---|---|---|---|---|---|---|
| s1(-) | 0.155 | 0.076 | 0.284 | 0.097 | 0.013 | 0.023 |
| s2(-) | 0.217 | 0.084 | 0.409 | 0.138 | -0.159 | 0.129 |
| s3(-) | 0.375 | 0.115 | -0.201 | 0.254 | -0.094 | -0.181 |
| s4(-) | 0.238 | 0.000 | 0.150 | 0.165 | -0.191 | 0.132 |
| s5(-) | -0.073 | -0.146 | 0.442 | -0.077 | -0.341 | 0.063 |
| s6(-) | 0.394 | 0.909 | 0.443 | 0.818 | 1.070 | 0.227 |
| s7(+) | 0.385 | 0.822 | 0.426 | 0.768 | 1.013 | 0.226 |
| s8(+) | 0.329 | 0.690 | 0.244 | 0.550 | 0.790 | 0.327 |
| s9(+) | 0.384 | 0.730 | 0.066 | 0.529 | 0.852 | 0.313 |
| s10(+) | -0.316 | -0.191 | 0.202 | -0.140 | 0.043 | 0.076 |
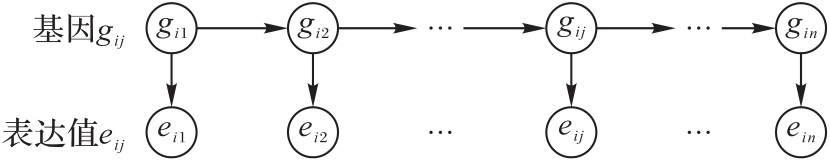
图1 隐马尔可夫基因模型图的结构
Fig. 1 Structure of hidden Markov gene model graph
| 样本 | 基因表达值降序排序 | 基因列下标序列 |
|---|---|---|
| s1(-) | 0.284(g3)→0.155(g1)→0.097(g4)→0.076(g2)→0.023(g6)→0.013(g5) | 3→1→4→2→6→5 |
| s2(-) | 0.409(g3)→0.217(g1)→0.138(g4)→0.129(g6)→0.084(g2)→-0.159(g5) | 3→1→4→6→2→5 |
| s3(-) | 0.375(g1)→0.254(g4)→0.115(g2)→-0.094(g5)→-0.181(g6)→-0.201(g3) | 1→4→2→5→6→3 |
| s4(-) | 0.238(g1)→0.165(g4)→0.150(g3)→0.132(g6)→0.000(g2)→-0.191(g5) | 1→4→3→6→2→5 |
| s5(-) | 0.442(g3)→0.063(g6)→-0.073(g1)→-0.077(g4)→-0.146(g2)→-0.341(g5) | 3→6→1→4→2→5 |
| s6(-) | 1.070(g5)→0.909(g2)→0.818(g4)→0.443(g3)→0.394(g1)→0.227(g6) | 5→2→4→3→1→6 |
| s7(+) | 1.013(g5)→0.822(g2)→0.768(g4)→0.426(g1)→0.385(g6)→0.226(g3) | 5→2→4→1→6→3 |
| s8(+) | 0.790(g5)→0.690(g2)→0.550(g4)→0.329(g1)→0.327(g6)→0.244(g3) | 5→2→4→1→6→3 |
| s9(+) | 0.852(g5)→0.730(g2)→0.529(g4)→0.384(g1)→0.313(g6)→0.066(g3) | 5→2→4→1→6→3 |
| s10(+) | 0.202(g3)→0.076(g6)→0.043(g5)→-0.140(g4)→-0.191(g2)→-0.316(g1) | 3→6→5→4→2→1 |
表2 基因表达值的降序排序及相应的下标序列
Tab. 2 Descending ordering of gene expression values and corresponding subscript sequences
| 样本 | 基因表达值降序排序 | 基因列下标序列 |
|---|---|---|
| s1(-) | 0.284(g3)→0.155(g1)→0.097(g4)→0.076(g2)→0.023(g6)→0.013(g5) | 3→1→4→2→6→5 |
| s2(-) | 0.409(g3)→0.217(g1)→0.138(g4)→0.129(g6)→0.084(g2)→-0.159(g5) | 3→1→4→6→2→5 |
| s3(-) | 0.375(g1)→0.254(g4)→0.115(g2)→-0.094(g5)→-0.181(g6)→-0.201(g3) | 1→4→2→5→6→3 |
| s4(-) | 0.238(g1)→0.165(g4)→0.150(g3)→0.132(g6)→0.000(g2)→-0.191(g5) | 1→4→3→6→2→5 |
| s5(-) | 0.442(g3)→0.063(g6)→-0.073(g1)→-0.077(g4)→-0.146(g2)→-0.341(g5) | 3→6→1→4→2→5 |
| s6(-) | 1.070(g5)→0.909(g2)→0.818(g4)→0.443(g3)→0.394(g1)→0.227(g6) | 5→2→4→3→1→6 |
| s7(+) | 1.013(g5)→0.822(g2)→0.768(g4)→0.426(g1)→0.385(g6)→0.226(g3) | 5→2→4→1→6→3 |
| s8(+) | 0.790(g5)→0.690(g2)→0.550(g4)→0.329(g1)→0.327(g6)→0.244(g3) | 5→2→4→1→6→3 |
| s9(+) | 0.852(g5)→0.730(g2)→0.529(g4)→0.384(g1)→0.313(g6)→0.066(g3) | 5→2→4→1→6→3 |
| s10(+) | 0.202(g3)→0.076(g6)→0.043(g5)→-0.140(g4)→-0.191(g2)→-0.316(g1) | 3→6→5→4→2→1 |
| 原子序列 | 次数 | 原子序列 | 次数 | 原子序列 | 次数 |
|---|---|---|---|---|---|
| 6→5 | 2 | 3→6 | 3 | 4→1 | 2 |
| 4→3 | 3 | 1→6 | 4 | 3→1 | 4 |
| 2→4 | 4 | 6→2 | 2 | 4→2 | 4 |
| 1→4 | 5 | 6→3 | 3 | ||
| 2→5 | 4 | 5→2 | 4 |
表3 频繁基因原子序列计数
Tab. 3 Frequent gene atomic sequence counts
| 原子序列 | 次数 | 原子序列 | 次数 | 原子序列 | 次数 |
|---|---|---|---|---|---|
| 6→5 | 2 | 3→6 | 3 | 4→1 | 2 |
| 4→3 | 3 | 1→6 | 4 | 3→1 | 4 |
| 2→4 | 4 | 6→2 | 2 | 4→2 | 4 |
| 1→4 | 5 | 6→3 | 3 | ||
| 2→5 | 4 | 5→2 | 4 |
| 序号 | 原子序列 | 关联熵 | 序号 | 原子序列 | 关联熵 |
|---|---|---|---|---|---|
| 1 | 5→2 | 0.805 | 8 | 4→2 | 1.257 |
| 2 | 4→3 | 0.852 | 9 | 2→4 | 1.318 |
| 3 | 2→5 | 0.856 | 10 | 3→6 | 1.386 |
| 4 | 6→5 | 0.946 | 11 | 6→2 | 1.453 |
| 5 | 6→3 | 1.007 | 12 | 4→1 | 1.568 |
| 6 | 3→1 | 1.109 | 13 | 1→6 | 2.047 |
| 7 | 1→4 | 1.159 |
表4 频繁基因原子序列关联熵
Tab. 4 Frequent gene atomic sequence association entropies
| 序号 | 原子序列 | 关联熵 | 序号 | 原子序列 | 关联熵 |
|---|---|---|---|---|---|
| 1 | 5→2 | 0.805 | 8 | 4→2 | 1.257 |
| 2 | 4→3 | 0.852 | 9 | 2→4 | 1.318 |
| 3 | 2→5 | 0.856 | 10 | 3→6 | 1.386 |
| 4 | 6→5 | 0.946 | 11 | 6→2 | 1.453 |
| 5 | 6→3 | 1.007 | 12 | 4→1 | 1.568 |
| 6 | 3→1 | 1.109 | 13 | 1→6 | 2.047 |
| 7 | 1→4 | 1.159 |
| 数据集 | 基因数 | 样本数 | 类别数 | |
|---|---|---|---|---|
| 肿瘤数据集 | Leukemia | 7 129 | 72 | 2 |
| Colon | 2 000 | 62 | 2 | |
| SRBCT | 2 308 | 83 | 4 | |
| Brain | 5 920 | 90 | 5 | |
| Breast | 10 | 683 | 2 | |
| Duke_bc | 7 129 | 44 | 2 | |
| 非肿瘤数据集 | Heart | 13 | 270 | 2 |
| Mushrooms | 112 | 8 124 | 2 | |
| Protein | 357 | 17 766 | 3 | |
表5 疾病基因表达数据集信息
Tab. 5 Details of disease gene expression datasets
| 数据集 | 基因数 | 样本数 | 类别数 | |
|---|---|---|---|---|
| 肿瘤数据集 | Leukemia | 7 129 | 72 | 2 |
| Colon | 2 000 | 62 | 2 | |
| SRBCT | 2 308 | 83 | 4 | |
| Brain | 5 920 | 90 | 5 | |
| Breast | 10 | 683 | 2 | |
| Duke_bc | 7 129 | 44 | 2 | |
| 非肿瘤数据集 | Heart | 13 | 270 | 2 |
| Mushrooms | 112 | 8 124 | 2 | |
| Protein | 357 | 17 766 | 3 | |
| 类型 | 被分为正类 | 被分为负类 |
|---|---|---|
| 实际为正类 | TP | FN |
| 实际为负类 | FP | TN |
表6 混淆矩阵
Tab. 6 Confusion matrix
| 类型 | 被分为正类 | 被分为负类 |
|---|---|---|
| 实际为正类 | TP | FN |
| 实际为负类 | FP | TN |
| 数据集 | BN_NB | BN_SA | CFWNB | WATAN | BN_CI | BN_ICS | BCGA | |
|---|---|---|---|---|---|---|---|---|
| 肿瘤数据集 | Leukemia | 0.483 | 0.505 | 0.411 | 0.428 | 0.406 | 0.370 | |
| Colon | 0.403 | 0.372 | 0.295 | 0.332 | 0.324 | 0.341 | ||
| SRBCT | 0.069 | 0.027 | 0.018 | 0.016 | 0.012 | 0.033 | ||
| Brain | 0.302 | 0.276 | 0.242 | 0.271 | 0.230 | 0.250 | ||
| Breast | 0.280 | 0.359 | 0.320 | 0.320 | 0.320 | 0.249 | ||
| Duke_bc | 0.492 | 0.453 | 0.315 | 0.308 | 0.325 | 0.330 | ||
| 平均RMSE | 0.335 | 0.317 | 0.275 | 0.280 | 0.277 | 0.252 | ||
| 序号平均值 | 6.000 | 5.000 | 3.833 | 4.167 | 3.000 | 3.667 | 2.333 | |
| 非肿瘤数据集 | Heart | 0.601 | 0.479 | 0.342 | 0.345 | 0.344 | 0.329 | |
| Mushrooms | 0.350 | 0.232 | 0.433 | 0.402 | 0.399 | 0.398 | ||
| Protein | 0.467 | 0.289 | 0.393 | 0.350 | 0.352 | 0.349 | ||
| 平均RMSE | 0.473 | 0.388 | 0.365 | 0.365 | 0.364 | 0.328 | ||
| 序号平均值 | 5.667 | 2.667 | 5.000 | 4.333 | 5.000 | 3.667 | 1.667 | |
| Overall RMSE | 0.381 | 0.322 | 0.313 | 0.308 | 0.306 | 0.277 | ||
| Overall Rank | 5.889 | 4.222 | 4.222 | 4.222 | 3.667 | 3.667 | 2.111 | |
表7 不同BN变体分类器的RMSE实验结果
Tab. 7 RMSE experimental results of different BN variant classifiers
| 数据集 | BN_NB | BN_SA | CFWNB | WATAN | BN_CI | BN_ICS | BCGA | |
|---|---|---|---|---|---|---|---|---|
| 肿瘤数据集 | Leukemia | 0.483 | 0.505 | 0.411 | 0.428 | 0.406 | 0.370 | |
| Colon | 0.403 | 0.372 | 0.295 | 0.332 | 0.324 | 0.341 | ||
| SRBCT | 0.069 | 0.027 | 0.018 | 0.016 | 0.012 | 0.033 | ||
| Brain | 0.302 | 0.276 | 0.242 | 0.271 | 0.230 | 0.250 | ||
| Breast | 0.280 | 0.359 | 0.320 | 0.320 | 0.320 | 0.249 | ||
| Duke_bc | 0.492 | 0.453 | 0.315 | 0.308 | 0.325 | 0.330 | ||
| 平均RMSE | 0.335 | 0.317 | 0.275 | 0.280 | 0.277 | 0.252 | ||
| 序号平均值 | 6.000 | 5.000 | 3.833 | 4.167 | 3.000 | 3.667 | 2.333 | |
| 非肿瘤数据集 | Heart | 0.601 | 0.479 | 0.342 | 0.345 | 0.344 | 0.329 | |
| Mushrooms | 0.350 | 0.232 | 0.433 | 0.402 | 0.399 | 0.398 | ||
| Protein | 0.467 | 0.289 | 0.393 | 0.350 | 0.352 | 0.349 | ||
| 平均RMSE | 0.473 | 0.388 | 0.365 | 0.365 | 0.364 | 0.328 | ||
| 序号平均值 | 5.667 | 2.667 | 5.000 | 4.333 | 5.000 | 3.667 | 1.667 | |
| Overall RMSE | 0.381 | 0.322 | 0.313 | 0.308 | 0.306 | 0.277 | ||
| Overall Rank | 5.889 | 4.222 | 4.222 | 4.222 | 3.667 | 3.667 | 2.111 | |
| 数据集 | LR | SVM | KNN | OB | LB | RF | BCGA | |
|---|---|---|---|---|---|---|---|---|
| 肿瘤数据集 | Leukemia | 0.767 | 0.744 | 0.802 | 0.754 | 0.807 | 0.813 | |
| Colon | 0.757 | 0.790 | 0.827 | 0.780 | 0.780 | 0.748 | ||
| SRBCT | 0.983 | 0.999 | 0.998 | 0.998 | 0.998 | |||
| Brain | 0.818 | 0.811 | 0.831 | 0.858 | 0.845 | 0.858 | ||
| Breast | 0.898 | 0.750 | 0.726 | 0.717 | 0.717 | 0.749 | ||
| Duke_bc | 0.758 | 0.795 | 0.850 | 0.850 | 0.844 | 0.864 | ||
| 平均准确率 | 0.830 | 0.834 | 0.825 | 0.835 | 0.828 | 0.848 | ||
| 序号平均值 | 5.333 | 4.333 | 3.333 | 4.583 | 3.917 | 4.500 | 2.000 | |
| 非肿瘤数据集 | Heart | 0.640 | 0.769 | 0.827 | 0.840 | 0.840 | 0.844 | |
| Mushrooms | 0.988 | 0.690 | 0.774 | 0.734 | 0.737 | 0.771 | ||
| Protein | 0.673 | 0.666 | 0.630 | 0.725 | 0.721 | 0.735 | ||
| 平均准确率 | 0.730 | 0.808 | 0.720 | 0.775 | 0.765 | 0.768 | ||
| 序号平均值 | 4.667 | 4.333 | 5.333 | 3.667 | 4.500 | 3.500 | 2.000 | |
| Overall Accuracy | 0.797 | 0.825 | 0.804 | 0.809 | 0.812 | 0.808 | 0.826 | |
| Overall Rank | 5.111 | 4.333 | 4.000 | 4.278 | 4.111 | 4.167 | 2.000 | |
表8 不同BN变体分类器的准确率实验结果
Tab. 8 Accuracy experimental results of different BN variant classifiers
| 数据集 | LR | SVM | KNN | OB | LB | RF | BCGA | |
|---|---|---|---|---|---|---|---|---|
| 肿瘤数据集 | Leukemia | 0.767 | 0.744 | 0.802 | 0.754 | 0.807 | 0.813 | |
| Colon | 0.757 | 0.790 | 0.827 | 0.780 | 0.780 | 0.748 | ||
| SRBCT | 0.983 | 0.999 | 0.998 | 0.998 | 0.998 | |||
| Brain | 0.818 | 0.811 | 0.831 | 0.858 | 0.845 | 0.858 | ||
| Breast | 0.898 | 0.750 | 0.726 | 0.717 | 0.717 | 0.749 | ||
| Duke_bc | 0.758 | 0.795 | 0.850 | 0.850 | 0.844 | 0.864 | ||
| 平均准确率 | 0.830 | 0.834 | 0.825 | 0.835 | 0.828 | 0.848 | ||
| 序号平均值 | 5.333 | 4.333 | 3.333 | 4.583 | 3.917 | 4.500 | 2.000 | |
| 非肿瘤数据集 | Heart | 0.640 | 0.769 | 0.827 | 0.840 | 0.840 | 0.844 | |
| Mushrooms | 0.988 | 0.690 | 0.774 | 0.734 | 0.737 | 0.771 | ||
| Protein | 0.673 | 0.666 | 0.630 | 0.725 | 0.721 | 0.735 | ||
| 平均准确率 | 0.730 | 0.808 | 0.720 | 0.775 | 0.765 | 0.768 | ||
| 序号平均值 | 4.667 | 4.333 | 5.333 | 3.667 | 4.500 | 3.500 | 2.000 | |
| Overall Accuracy | 0.797 | 0.825 | 0.804 | 0.809 | 0.812 | 0.808 | 0.826 | |
| Overall Rank | 5.111 | 4.333 | 4.000 | 4.278 | 4.111 | 4.167 | 2.000 | |
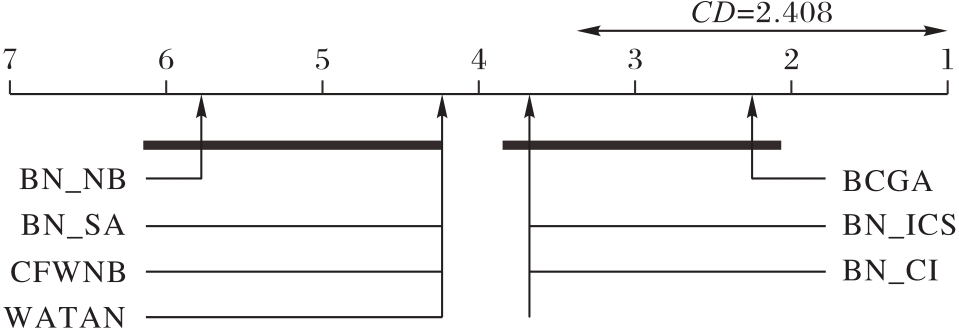
图2 Nemenyi检验在RMSE上的比较结果
Fig. 2 Comparison results of Nemenyi test in RMSE
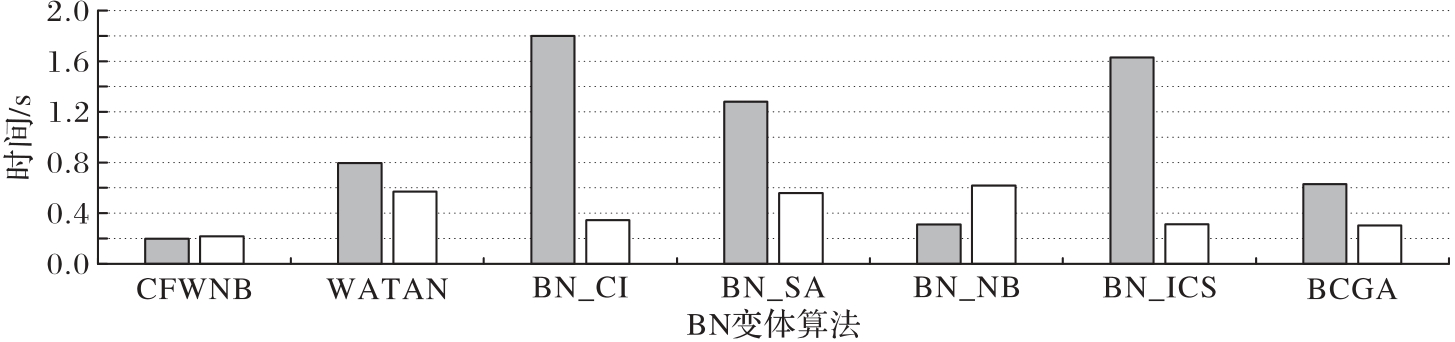
图3 平均训练和测试时间比较
Fig. 3 Comparison of average training and test time
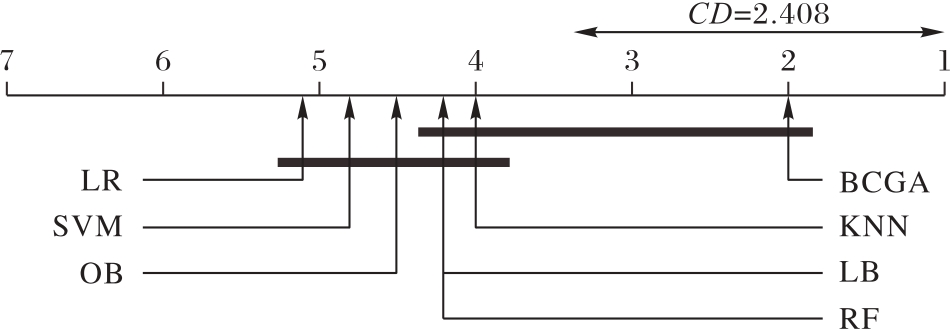
图4 Nemenyi检验在Accuracy上的比较结果
Fig. 4 Comparison results of Nemenyi on accuracy
| 数据集 | LR | SVM | KNN | OB | LB | RF | BCGA |
|---|---|---|---|---|---|---|---|
| W/D/L | 5/0/1 | 4/1/1 | 4/1/1 | 5/1/0 | 4/2/0 | 5/1/0 | — |
| Leukemia | 0.767- | 0.737- | 0.993+ | 0.731- | 0.793- | 0.801- | 0.927 |
| Colon | 0.535- | 0.807- | 0.780- | 0.808- | 0.789- | 0.791- | 0.904 |
| Breast | 0.810- | 0.931= | 0.855- | 0.871- | 0.856- | 0.889- | 0.979 |
| Duke_bc | 0.685- | 0.795- | 0.853- | 0.806- | 0.806- | 0.801- | 0.907 |
| Heart | 0.448- | 0.755- | 0.829= | 0.804- | 0.827= | 0.819- | 0.864 |
| Mushrooms | 0.871+ | 0.988+ | 0.675- | 0.733= | 0.683= | 0.687= | 0.719 |
表9 不同算法在6个数据集上的F1-Score结果
Tab. 9 F1-Score results of different algorithms on 6 datasets
| 数据集 | LR | SVM | KNN | OB | LB | RF | BCGA |
|---|---|---|---|---|---|---|---|
| W/D/L | 5/0/1 | 4/1/1 | 4/1/1 | 5/1/0 | 4/2/0 | 5/1/0 | — |
| Leukemia | 0.767- | 0.737- | 0.993+ | 0.731- | 0.793- | 0.801- | 0.927 |
| Colon | 0.535- | 0.807- | 0.780- | 0.808- | 0.789- | 0.791- | 0.904 |
| Breast | 0.810- | 0.931= | 0.855- | 0.871- | 0.856- | 0.889- | 0.979 |
| Duke_bc | 0.685- | 0.795- | 0.853- | 0.806- | 0.806- | 0.801- | 0.907 |
| Heart | 0.448- | 0.755- | 0.829= | 0.804- | 0.827= | 0.819- | 0.864 |
| Mushrooms | 0.871+ | 0.988+ | 0.675- | 0.733= | 0.683= | 0.687= | 0.719 |
| 数据集 | LR | SVM | KNN | OB | LB | RF | BCGA |
|---|---|---|---|---|---|---|---|
| W/D/L | 5/1/0 | 4/1/1 | 4/1/1 | 1/5/0 | 0/6/0 | 0/6/0 | — |
| Leukemia | 0.524- | 0.722- | 0.852- | 0.812- | 0.920= | 0.911= | 0.919 |
| Colon | 0.811- | 0.780- | 0.873= | 0.893= | 0.894= | 0.896= | 0.895 |
| Breast | 0.687- | 0.968= | 0.929- | 0.958= | 0.947= | 0.968= | 0.972 |
| Duke_bc | 0.764- | 0.716- | 0.917= | 0.920= | 0.922= | 0.920= | 0.920 |
| Heart | 0.835- | 0.752- | 0.928+ | 0.882= | 0.904= | 0.901= | 0.899 |
| Mushrooms | 0.829= | 1.000+ | 0.768- | 0.823= | 0.837= | 0.838= | 0.822 |
表10 不同算法在6个数据集上的AUC结果
Tab. 10 AUC results of different algorithms on 6 datasets
| 数据集 | LR | SVM | KNN | OB | LB | RF | BCGA |
|---|---|---|---|---|---|---|---|
| W/D/L | 5/1/0 | 4/1/1 | 4/1/1 | 1/5/0 | 0/6/0 | 0/6/0 | — |
| Leukemia | 0.524- | 0.722- | 0.852- | 0.812- | 0.920= | 0.911= | 0.919 |
| Colon | 0.811- | 0.780- | 0.873= | 0.893= | 0.894= | 0.896= | 0.895 |
| Breast | 0.687- | 0.968= | 0.929- | 0.958= | 0.947= | 0.968= | 0.972 |
| Duke_bc | 0.764- | 0.716- | 0.917= | 0.920= | 0.922= | 0.920= | 0.920 |
| Heart | 0.835- | 0.752- | 0.928+ | 0.882= | 0.904= | 0.901= | 0.899 |
| Mushrooms | 0.829= | 1.000+ | 0.768- | 0.823= | 0.837= | 0.838= | 0.822 |
| 数据集 | 算法 | 准确率 | RMSE | F1-Score | AUC |
|---|---|---|---|---|---|
| Leukemia | BN | 0.714 | 0.483 | 0.753 | 0.802 |
| BN+GA | 0.765 | 0.462 | 0.847 | 0.909 | |
| BN+GCPT | 0.805 | 0.390 | 0.901 | 0.903 | |
| BCGA | 0.813 | 0.370 | 0.928 | 0.919 | |
| Colon | BN | 0.693 | 0.403 | 0.802 | 0.821 |
| BN+GA | 0.768 | 0.377 | 0.901 | 0.854 | |
| BN+GCPT | 0.796 | 0.380 | 0.899 | 0.878 | |
| BCGA | 0.804 | 0.317 | 0.905 | 0.896 | |
| Breast | BN | 0.663 | 0.261 | 0.843 | 0.843 |
| BN+GA | 0.632 | 0.283 | 0.881 | 0.880 | |
| BN+GCPT | 0.692 | 0.248 | 0.839 | 0.936 | |
| BCGA | 0.749 | 0.249 | 0.979 | 0.972 | |
| Heart | BN | 0.716 | 0.601 | 0.771 | 0.801 |
| BN+GA | 0.716 | 0.599 | 0.773 | 0.810 | |
| BN+GCPT | 0.808 | 0.480 | 0.818 | 0.856 | |
| BCGA | 0.844 | 0.329 | 0.864 | 0.900 | |
| Mushrooms | BN | 0.642 | 0.350 | 0.611 | 0.771 |
| BN+GA | 0.650 | 0.345 | 0.613 | 0.781 | |
| BN+GCPT | 0.712 | 0.325 | 0.736 | 0.821 | |
| BCGA | 0.771 | 0.316 | 0.719 | 0.823 |
表11 BCGA在5个数据集上的消融实验结果
Tab. 11 BCGA ablation experimental results on 5 datasets
| 数据集 | 算法 | 准确率 | RMSE | F1-Score | AUC |
|---|---|---|---|---|---|
| Leukemia | BN | 0.714 | 0.483 | 0.753 | 0.802 |
| BN+GA | 0.765 | 0.462 | 0.847 | 0.909 | |
| BN+GCPT | 0.805 | 0.390 | 0.901 | 0.903 | |
| BCGA | 0.813 | 0.370 | 0.928 | 0.919 | |
| Colon | BN | 0.693 | 0.403 | 0.802 | 0.821 |
| BN+GA | 0.768 | 0.377 | 0.901 | 0.854 | |
| BN+GCPT | 0.796 | 0.380 | 0.899 | 0.878 | |
| BCGA | 0.804 | 0.317 | 0.905 | 0.896 | |
| Breast | BN | 0.663 | 0.261 | 0.843 | 0.843 |
| BN+GA | 0.632 | 0.283 | 0.881 | 0.880 | |
| BN+GCPT | 0.692 | 0.248 | 0.839 | 0.936 | |
| BCGA | 0.749 | 0.249 | 0.979 | 0.972 | |
| Heart | BN | 0.716 | 0.601 | 0.771 | 0.801 |
| BN+GA | 0.716 | 0.599 | 0.773 | 0.810 | |
| BN+GCPT | 0.808 | 0.480 | 0.818 | 0.856 | |
| BCGA | 0.844 | 0.329 | 0.864 | 0.900 | |
| Mushrooms | BN | 0.642 | 0.350 | 0.611 | 0.771 |
| BN+GA | 0.650 | 0.345 | 0.613 | 0.781 | |
| BN+GCPT | 0.712 | 0.325 | 0.736 | 0.821 | |
| BCGA | 0.771 | 0.316 | 0.719 | 0.823 |
| 数据集 | 噪声比例/% | GB | GA |
|---|---|---|---|
| Leukemia | 0 | 0.714 | 0.765 |
| 10 | 0.643 | 0.726 | |
| 20 | 0.572 | 0.688 | |
| 30 | 0.500 | 0.650 | |
| Colon | 0 | 0.693 | 0.768 |
| 10 | 0.623 | 0.729 | |
| 20 | 0.554 | 0.691 | |
| 30 | 0.485 | 0.653 | |
| Breast | 0 | 0.663 | 0.632 |
| 10 | 0.597 | 0.600 | |
| 20 | 0.531 | 0.569 | |
| 30 | 0.465 | 0.536 | |
| Heart | 0 | 0.716 | 0.716 |
| 10 | 0.645 | 0.680 | |
| 20 | 0.573 | 0.644 | |
| 30 | 0.522 | 0.593 | |
| Mushrooms | 0 | 0.642 | 0.650 |
| 10 | 0.578 | 0.618 | |
| 20 | 0.534 | 0.585 | |
| 30 | 0.514 | 0.552 |
表12 对5个数据集加噪后的准确率
Tab. 12 Accuracies after adding noise to 5 datasets
| 数据集 | 噪声比例/% | GB | GA |
|---|---|---|---|
| Leukemia | 0 | 0.714 | 0.765 |
| 10 | 0.643 | 0.726 | |
| 20 | 0.572 | 0.688 | |
| 30 | 0.500 | 0.650 | |
| Colon | 0 | 0.693 | 0.768 |
| 10 | 0.623 | 0.729 | |
| 20 | 0.554 | 0.691 | |
| 30 | 0.485 | 0.653 | |
| Breast | 0 | 0.663 | 0.632 |
| 10 | 0.597 | 0.600 | |
| 20 | 0.531 | 0.569 | |
| 30 | 0.465 | 0.536 | |
| Heart | 0 | 0.716 | 0.716 |
| 10 | 0.645 | 0.680 | |
| 20 | 0.573 | 0.644 | |
| 30 | 0.522 | 0.593 | |
| Mushrooms | 0 | 0.642 | 0.650 |
| 10 | 0.578 | 0.618 | |
| 20 | 0.534 | 0.585 | |
| 30 | 0.514 | 0.552 |
| 数据集 | 网络总边数 | 算法 | 正确边数 | 正确边占比 |
|---|---|---|---|---|
| ALARM | 46 | GB | 22 | 0.48 |
| GSB | 39 | 0.85 | ||
| mildew | 46 | GB | 28 | 0.61 |
| GSB | 38 | 0.83 | ||
| gene1 | 132 | GB | 65 | 0.49 |
| GSB | 97 | 0.73 | ||
| gene2 | 272 | GB | 132 | 0.49 |
| GSB | 193 | 0.71 |
表13 GB和GSB算法在4个数据集上的对比
Tab. 13 Comparison of GB and GSB algorithms on 4 datasets
| 数据集 | 网络总边数 | 算法 | 正确边数 | 正确边占比 |
|---|---|---|---|---|
| ALARM | 46 | GB | 22 | 0.48 |
| GSB | 39 | 0.85 | ||
| mildew | 46 | GB | 28 | 0.61 |
| GSB | 38 | 0.83 | ||
| gene1 | 132 | GB | 65 | 0.49 |
| GSB | 97 | 0.73 | ||
| gene2 | 272 | GB | 132 | 0.49 |
| GSB | 193 | 0.71 |
| 1 | YANG X, WANG Z, SUN J, et al. Unlabeled data driven cost-sensitive inverse projection sparse representation-based classification with 1/2 regularization[J]. SCIENCE CHINA Information Sciences, 2022, 65(8): No.182102. |
| 2 | 姜涛,李战怀.基因数据表达中的局部模式挖掘研究综述[J]. 计算机研究与发展,2018,55(11):2343-2360. |
| JIANG T, LI Z H. A survey on local pattern mining in gene expression data[J]. Journal of Computer Research and Development, 2018, 55(11): 2343-2360. | |
| 3 | CHADDAD A, LU Q, LI J, et al. Explainable, domain-adaptive, and federated artificial intelligence in medicine[J]. IEEE/CAA Journal of Automatica Sinica, 2023, 10(4): 859-876. |
| 4 | PAN H, ZHANG Y, CHENG J, et al. Symplectic geometry transformation-based periodic segment method: algorithm and applications[J]. IEEE Transactions on Instrumentation and Measurement, 2023, 72: No.6502708. |
| 5 | 樊航旗.基于集成学习的贝叶斯因果森林研究[D].长春:吉林大学,2022:7-20. |
| FAN H Q. Research of Bayesian causal forest based on ensemble learning[D]. Changchun: Jilin University, 2022: 7-20. | |
| 6 | SHEN T, ZHANG J, JIA X, et al. Federated mutual learning: a collaborative machine learning method for heterogeneous data, models, and objectives[J]. Frontiers of Information Technology and Electronic Engineering, 2023, 24(10): 1390-1402. |
| 7 | JIANG L, ZHANG L, YU L, et al. Class-specific attribute weighted naive Bayes[J]. Pattern Recognition, 2019, 88: 321-330. |
| 8 | YAO H, SHE J, ZHOU Y. Risk assessment of construction safety accidents based on association rule mining and Bayesian network[J]. Journal of Intelligent Construction, 2024, 2: No.9180015. |
| 9 | MA Y, ZHANG W, DU M, et al. Hierarchical Bayesian causality network to extract high-level semantic information in visual cortex[J]. International Journal of Neural Systems, 2024, 34(1): No.2450002. |
| 10 | WANG L, QI S, LIU Y, et al. Bagging k-dependence Bayesian network classifiers[J]. Intelligent Data Analysis, 2021, 25(3): 641-667. |
| 11 | LIU Y, WANG L, MAMMADOV M. Learning semi-lazy Bayesian network classifier under the c.i.i.d assumption[J]. Knowledge-Based Systems, 2020, 208: No.106422. |
| 12 | HECKERMAN D. A Bayesian approach to learning causal networks[C]// Proceedings of the 11th Conference on Uncertainty in Artificial Intelligence. San Francisco: Morgan Kaufmann Publishers Inc., 1995: 285-295. |
| 13 | KONG H, SHI X, WANG L, et al. Averaged tree-augmented one-dependence estimators[J]. Applied Intelligence, 2021, 51(7): 4270-4286. |
| 14 | 鱼亮,任姝洁.基于网络和基因差异表达信息的癌症致病基因预测[J]. 中国科学:生命科学,2023,53(1):94-108. |
| YU L, REN S J. Prediction of cancerous pathogenic genes based on network and gene differential expression information[J]. SCIENTIA SINICA Vitae, 2023, 53(1): 94-108. | |
| 15 | LI X, CHANG M, WANG L. Information recognition of pathogenic modules in gene statistics of big data[J]. Nanomaterials and Energy, 2021, 10(1): 35-42. |
| 16 | WANG C, ZHANG J, WANG X, et al. Pathogenic gene prediction algorithm based on heterogeneous information fusion[J]. Frontiers in Genetics, 2020, 11: No.5. |
| 17 | ZHU J F, HAO Z K, LIU Q, et al. Towards exploring large molecular space: an efficient chemical genetic algorithm[J]. Journal of Computer Science and Technology, 2022, 37(6): 1464-1477. |
| 18 | WANG L, CHEN P, CHEN S, et al. A novel approach to fully representing the diversity in conditional dependencies for learning Bayesian network classifier[J]. Intelligent Data Analysis, 2021, 25(11): 35-55. |
| 19 | SUN J, TAYLOR D, BOLLT E M. Causal network inference by optimal causation entropy[J]. SIAM Journal on Applied Dynamical Systems, 2015, 14(3): 73-106. |
| 20 | DUAN Z, WANG L, CHEN S, et al. Instance-based weighting filter for superparent one-dependence estimators[J]. Knowledge-Based Systems, 2020, 203: No.106085. |
| 21 | JIANG L, ZHANG L, LI C, et al. A correlation-based feature weighting filter for naive Bayes[J]. IEEE Transactions on Knowledge and Data Engineering, 2019, 31(2): 201-213. |
| 22 | JIANG L, CAI Z, WANG D, et al. Improving tree augmented naive Bayes for class probability estimation[J]. Knowledge-Based Systems, 2012, 26: 239-245. |
| 23 | CABUZ S, ABREU G. Causal inference for multivariate stochastic process prediction[J]. Information Sciences, 2018, 448/449: 134-148. |
| [1] | 张全梅, 黄润萍, 滕飞, 张海波, 周南. 融合异构信息的自动国际疾病分类编码方法[J]. 《计算机应用》唯一官方网站, 2024, 44(8): 2476-2482. |
| [2] | 周晓敏, 滕飞, 张艺. 基于元网络的自动国际疾病分类编码模型[J]. 《计算机应用》唯一官方网站, 2023, 43(9): 2721-2726. |
| [3] | 高慧云, 陆慧娟, 严珂, 叶敏超. 基于差异性和准确性的加权调和平均度量的 基因表达数据选择性集成算法[J]. 计算机应用, 2018, 38(5): 1512-1516. |
| [4] | 高盼盼, 王宁, 周雪忠, 刘光明, 王惠欣. 面向疾病分类的人类互作网络拓扑模块的功能同质性分析[J]. 计算机应用, 2016, 36(8): 2144-2149. |
| [5] | 赵宇海,王国仁,印莹. 一种用于基因表达数据的无参数聚类算法[J]. 计算机应用, 2005, 25(06): 1388-1391. |
| 阅读次数 | ||||||
|
全文 |
|
|||||
|
摘要 |
|
|||||