


《计算机应用》唯一官方网站 ›› 2022, Vol. 42 ›› Issue (7): 2265-2273.DOI: 10.11772/j.issn.1001-9081.2021081487
李晓寒1( ), 王俊1, 贾华丁1, 萧刘2
收稿日期:2021-08-19
修回日期:2021-11-30
接受日期:2021-12-03
发布日期:2022-01-07
出版日期:2022-07-10
通讯作者:
李晓寒
作者简介:王俊(1987—),男,山东青岛人,副教授,博士,CCF会员,主要研究方向:金融科技、金融智能基金资助:
Xiaohan LI1(), Jun WANG1, Huading JIA1, Liu XIAO2
Received:2021-08-19
Revised:2021-11-30
Accepted:2021-12-03
Online:2022-01-07
Published:2022-07-10
Contact:
Xiaohan LI
About author:WANG Jun, born in 1987, Ph. D., associate professor. His research interests include financial technology, financial intelligence.Supported by:摘要:
股票市场是金融市场关键组成部分,因此对股票市场波动的研究对合理化控制金融市场风险、提高投资收益提供了重要支持,一直以来都是学术界和相关业界的关注焦点,然而,股票市场会受到各种因素的影响。面对股票市场中多源化、异构化的信息,如何高效挖掘、融合股票市场的多源异构数据具有挑战性。为了充分解释不同信息及信息间相互作用对于股票市场价格波动的影响,提出一种基于多重注意力机制的图神经网络来预测股票市场的价格波动。首先,引入关系维度构建股票市场交易数据和新闻文本的异构子图,并利用多重注意力机制实现图数据的融合;其次,通过图神经网络门控循环单元(GRU)进行图分类,在此基础上完成对股票市场中上证综合指数、沪深300指数、深证成份指数这三个重要指数波动的预测。实验结果表明,从异构信息特性角度,相较于股票市场交易数据,股市新闻信息对于股票价格影响存在滞后性;从异构信息融合角度,所提方法与支持向量机(SVM)、随机森林、多核k-means (MKKM)聚类等算法相比,预测准确率分别提升了17.88个百分点、30.00个百分点和38.00个百分点,并进行了模型交易策略的量化投资模拟。
中图分类号:
李晓寒, 王俊, 贾华丁, 萧刘. 基于多重注意力机制的图神经网络股市波动预测方法[J]. 计算机应用, 2022, 42(7): 2265-2273.
Xiaohan LI, Jun WANG, Huading JIA, Liu XIAO. Stock market volatility prediction method based on graph neural network with multi-attention mechanism[J]. Journal of Computer Applications, 2022, 42(7): 2265-2273.

图1 本文模型整体框架
Fig.1 Overall framework of the proposed model

图2 图数据嵌入方法
Fig.2 Graph data embedding method
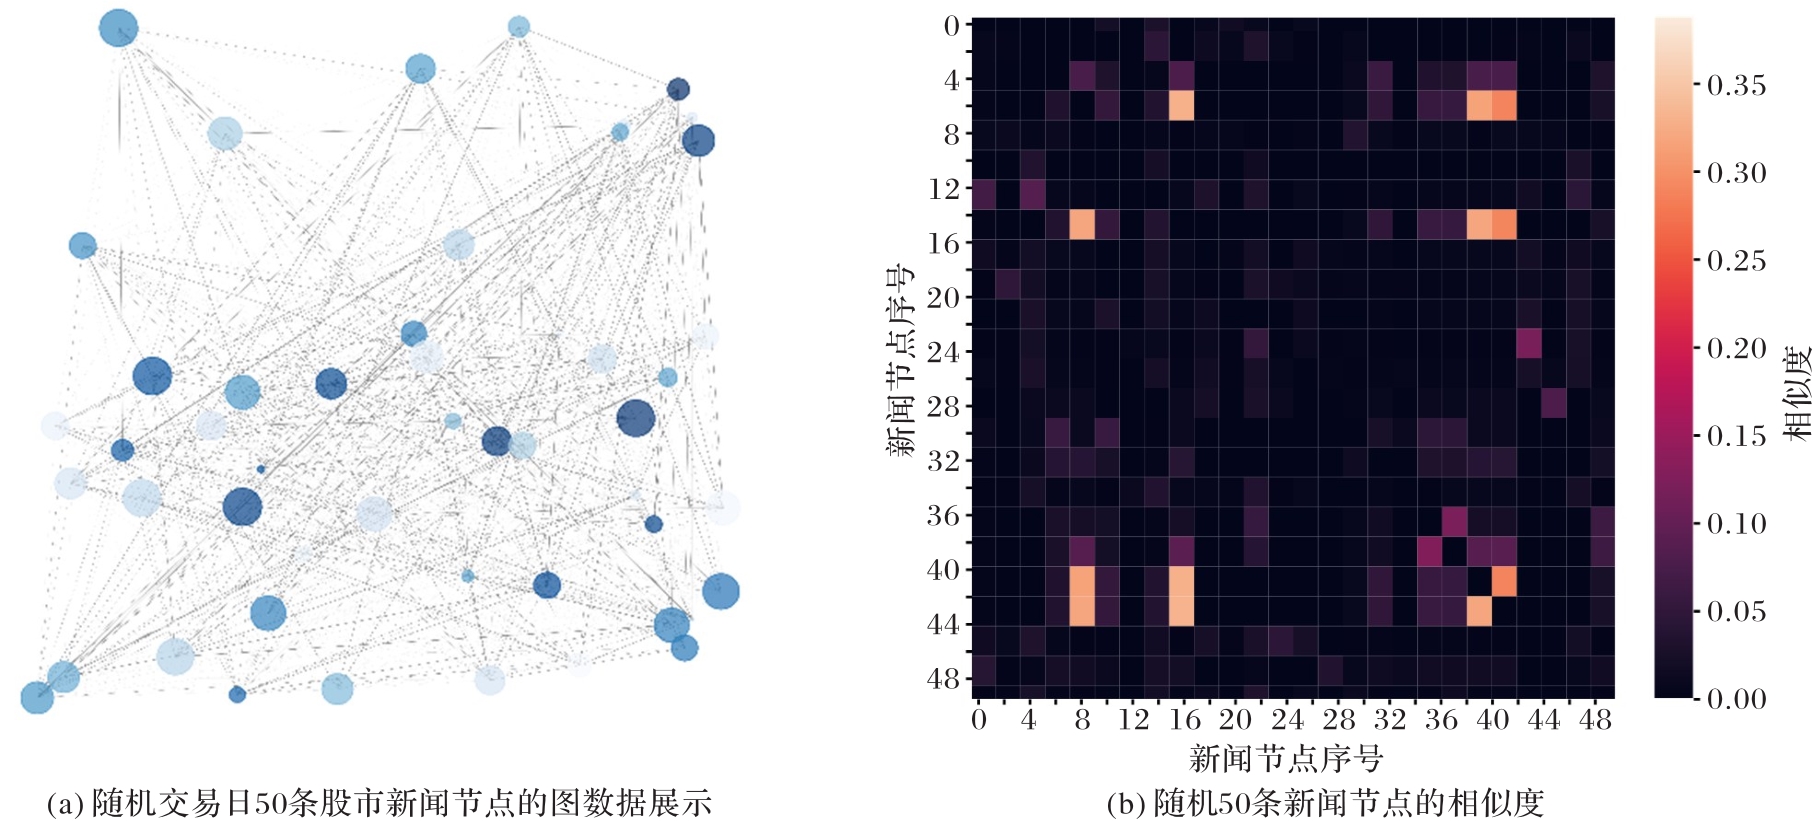
图3 股市新闻图数据
Fig.3 Stock market news graph data

图4 图神经网络训练过程
Fig.4 Training process of graph neural network
| 真实值 | 预测值 | |
|---|---|---|
| 上涨 | 下跌 | |
| 上涨 | TP | FN |
| 下跌 | FP | TN |
表1 混淆矩阵
Tab. 1 Confusion matrix
| 真实值 | 预测值 | |
|---|---|---|
| 上涨 | 下跌 | |
| 上涨 | TP | FN |
| 下跌 | FP | TN |
| 方法 | 卷积名称 | Input size | Out size | Drop Rate | Aggregator Type |
|---|---|---|---|---|---|
| 本文方法 | GRATConv1 | 200 | 128 | 0.1 | LSTM |
| GRATConv2 | 128 | 64 | 0.0 | LSTM | |
| GAT | GATConv1 | 200 | 128 | 0.1 | num_heads=3 |
| GATConv2 | 128 | 64 | 0.0 | num_heads=3 | |
| RelGraph | RelGraphConv1 | 200 | 128 | 0.1 | regularizer=basis |
| RelGraphConv2 | 128 | 64 | 0.0 | regularizer=basis | |
| Edge | EdgeConv1 | 200 | 128 | 0.1 | |
| EdgeConv2 | 128 | 64 | 0.0 | ||
| SAGE | SAGEConv1 | 200 | 128 | 0.1 | LSTM |
| SAGEConv2 | 128 | 64 | 0.0 | LSTM |
表2 实验网络参数设置
Tab. 2 Parameter setting of experimental networks
| 方法 | 卷积名称 | Input size | Out size | Drop Rate | Aggregator Type |
|---|---|---|---|---|---|
| 本文方法 | GRATConv1 | 200 | 128 | 0.1 | LSTM |
| GRATConv2 | 128 | 64 | 0.0 | LSTM | |
| GAT | GATConv1 | 200 | 128 | 0.1 | num_heads=3 |
| GATConv2 | 128 | 64 | 0.0 | num_heads=3 | |
| RelGraph | RelGraphConv1 | 200 | 128 | 0.1 | regularizer=basis |
| RelGraphConv2 | 128 | 64 | 0.0 | regularizer=basis | |
| Edge | EdgeConv1 | 200 | 128 | 0.1 | |
| EdgeConv2 | 128 | 64 | 0.0 | ||
| SAGE | SAGEConv1 | 200 | 128 | 0.1 | LSTM |
| SAGEConv2 | 128 | 64 | 0.0 | LSTM |
| 方法 | 参数 |
|---|---|
| SVM | C=0.8;kernel=liner;max_iter=1 000 |
| RF | Max_ feature=none;min_samples_split=10;n_estimators=3 |
| MKKM | View=3;kernel=RBF;gamma=1/3;k=2 |
| TeSIA | Tensor_order=3;tensor_size(i=5, j=1,k=10);Max_iter=5 000 |
表3 实验模型参数设置
Tab. 3 Parameter setting of experimental models
| 方法 | 参数 |
|---|---|
| SVM | C=0.8;kernel=liner;max_iter=1 000 |
| RF | Max_ feature=none;min_samples_split=10;n_estimators=3 |
| MKKM | View=3;kernel=RBF;gamma=1/3;k=2 |
| TeSIA | Tensor_order=3;tensor_size(i=5, j=1,k=10);Max_iter=5 000 |
| 方法 | 上证综合指数 | 沪深300指数 | 深证成份指数 | |||||||||||||||
|---|---|---|---|---|---|---|---|---|---|---|---|---|---|---|---|---|---|---|
| 交易日T+1 | 交易日T+2 | 交易日T+3 | 交易日T+1 | 交易日T+2 | 交易日T+3 | 交易日T+1 | 交易日T+2 | 交易日T+3 | ||||||||||
| 召回率 | 准确率 | 召回率 | 准确率 | 召回率 | 准确率 | 召回率 | 准确率 | 召回率 | 准确率 | 召回率 | 准确率 | 召回率 | 准确率 | 召回率 | 准确率 | 召回率 | 准确率 | |
| 本文方法 | 0.65 | 0.58 | 0.75 | 0.73 | 0.61 | 0.60 | 0.75 | 0.76 | 0.90 | 0.85 | 0.72 | 0.63 | 0.65 | 0.64 | 0.89 | 0.91 | 0.66 | 0.73 |
| GATConv | 0.53 | 0.58 | 0.57 | 0.51 | 0.46 | 0.43 | 0.69 | 0.53 | 0.49 | 0.45 | 0.62 | 0.47 | 0.48 | 0.52 | 0.63 | 0.61 | 0.42 | 0.45 |
| RelGraphConv | 0.52 | 0.53 | 0.49 | 0.50 | 0.47 | 0.39 | 0.64 | 0.54 | 0.63 | 0.49 | 0.55 | 0.47 | 0.44 | 0.47 | 0.45 | 0.53 | 0.47 | 0.50 |
| EdgeConv | 0.39 | 0.37 | 0.61 | 0.56 | 0.31 | 0.38 | 0.50 | 0.51 | 0.54 | 0.53 | 0.59 | 0.53 | 0.47 | 0.45 | 0.34 | 0.44 | 0.38 | 0.41 |
| SAGEConv | 0.48 | 0.45 | 0.50 | 0.48 | 0.52 | 0.49 | 0.43 | 0.38 | 0.39 | 0.49 | 0.52 | 0.38 | 0.38 | 0.47 | 0.30 | 0.38 | 0.31 | 0.33 |
| SVM | 0.58 | 0.56 | 0.58 | 0.55 | 0.54 | 0.53 | 0.46 | 0.46 | 0.47 | 0.48 | 0.46 | 0.45 | 0.44 | 0.47 | 0.57 | 0.58 | 0.43 | 0.40 |
| RF | 0.56 | 0.60 | 0.60 | 0.59 | 0.55 | 0.52 | 0.56 | 0.55 | 0.51 | 0.53 | 0.51 | 0.48 | 0.57 | 0.52 | 0.52 | 0.43 | 0.53 | 0.46 |
| MKKM | 0.58 | 0.56 | 0.62 | 0.60 | 0.60 | 0.59 | 0.68 | 0.66 | 0.68 | 0.70 | 0.62 | 0.57 | 0.62 | 0.56 | 0.63 | 0.70 | 0.65 | 0.58 |
| TeSIA | 0.52 | 0.58 | 0.63 | 0.62 | 0.58 | 0.57 | 0.62 | 0.67 | 0.69 | 0.73 | 0.68 | 0.56 | 0.61 | 0.59 | 0.63 | 0.57 | 0.62 | 0.59 |
表4 不同指数预测结果对比
Tab. 4 Predicted results comparison of different indexes
| 方法 | 上证综合指数 | 沪深300指数 | 深证成份指数 | |||||||||||||||
|---|---|---|---|---|---|---|---|---|---|---|---|---|---|---|---|---|---|---|
| 交易日T+1 | 交易日T+2 | 交易日T+3 | 交易日T+1 | 交易日T+2 | 交易日T+3 | 交易日T+1 | 交易日T+2 | 交易日T+3 | ||||||||||
| 召回率 | 准确率 | 召回率 | 准确率 | 召回率 | 准确率 | 召回率 | 准确率 | 召回率 | 准确率 | 召回率 | 准确率 | 召回率 | 准确率 | 召回率 | 准确率 | 召回率 | 准确率 | |
| 本文方法 | 0.65 | 0.58 | 0.75 | 0.73 | 0.61 | 0.60 | 0.75 | 0.76 | 0.90 | 0.85 | 0.72 | 0.63 | 0.65 | 0.64 | 0.89 | 0.91 | 0.66 | 0.73 |
| GATConv | 0.53 | 0.58 | 0.57 | 0.51 | 0.46 | 0.43 | 0.69 | 0.53 | 0.49 | 0.45 | 0.62 | 0.47 | 0.48 | 0.52 | 0.63 | 0.61 | 0.42 | 0.45 |
| RelGraphConv | 0.52 | 0.53 | 0.49 | 0.50 | 0.47 | 0.39 | 0.64 | 0.54 | 0.63 | 0.49 | 0.55 | 0.47 | 0.44 | 0.47 | 0.45 | 0.53 | 0.47 | 0.50 |
| EdgeConv | 0.39 | 0.37 | 0.61 | 0.56 | 0.31 | 0.38 | 0.50 | 0.51 | 0.54 | 0.53 | 0.59 | 0.53 | 0.47 | 0.45 | 0.34 | 0.44 | 0.38 | 0.41 |
| SAGEConv | 0.48 | 0.45 | 0.50 | 0.48 | 0.52 | 0.49 | 0.43 | 0.38 | 0.39 | 0.49 | 0.52 | 0.38 | 0.38 | 0.47 | 0.30 | 0.38 | 0.31 | 0.33 |
| SVM | 0.58 | 0.56 | 0.58 | 0.55 | 0.54 | 0.53 | 0.46 | 0.46 | 0.47 | 0.48 | 0.46 | 0.45 | 0.44 | 0.47 | 0.57 | 0.58 | 0.43 | 0.40 |
| RF | 0.56 | 0.60 | 0.60 | 0.59 | 0.55 | 0.52 | 0.56 | 0.55 | 0.51 | 0.53 | 0.51 | 0.48 | 0.57 | 0.52 | 0.52 | 0.43 | 0.53 | 0.46 |
| MKKM | 0.58 | 0.56 | 0.62 | 0.60 | 0.60 | 0.59 | 0.68 | 0.66 | 0.68 | 0.70 | 0.62 | 0.57 | 0.62 | 0.56 | 0.63 | 0.70 | 0.65 | 0.58 |
| TeSIA | 0.52 | 0.58 | 0.63 | 0.62 | 0.58 | 0.57 | 0.62 | 0.67 | 0.69 | 0.73 | 0.68 | 0.56 | 0.61 | 0.59 | 0.63 | 0.57 | 0.62 | 0.59 |

图5 不同分类器预测的ROC AUC图
Fig.5 Prediction ROC AUC diagrams of different classifiers

图6 不同指数策略收益
Fig.6 Strategy returns of different indexes
| 1 | FAMA E F. Efficient capital markets: a review of theory and empirical work[J]. The Journal of Finance, 1970, 25(2): 383-417. 10.1111/j.1540-6261.1970.tb00518.x |
| 2 | KAHNEMAN D. Maps of bounded rationality: psychology for behavioral economics[J]. The American Economic Review, 2003, 93(5): 1449-1475. 10.1257/000282803322655392 |
| 3 | SHILLER R J. Irrational Exuberance[M]. Revised and Expanded 3rd Ed. Princeton: Princeton University Press, 2016:237-267. 10.1515/9781400865536 |
| 4 | HONG H, KUBIK J D, STEIN J C. Social interaction and stock-market participation[J]. The Journal of Finance, 2004, 59(1): 137-163. 10.1111/j.1540-6261.2004.00629.x |
| 5 | STROHSAL T, WEBER E. Time-varying international stock market interaction and the identification of volatility signals[J]. Journal of Banking and Finance, 2015, 56: 28-36. 10.1016/j.jbankfin.2015.01.020 |
| 6 | OLIVEIRA N, CORTEZ P, AREAL N. The impact of microblogging data for stock market prediction: using Twitter to predict returns, volatility, trading volume and survey sentiment indices[J]. Expert Systems with Applications, 2017, 73: 125-144. 10.1016/j.eswa.2016.12.036 |
| 7 | CAKICI N, FABOZZI F J, TAN S. Size, value, and momentum in emerging market stock returns[J]. Emerging Markets Review, 2013, 16: 46-65. 10.1016/j.ememar.2013.03.001 |
| 8 | BURTON R F. Why is the body mass index calculated as mass/height2, not as mass/height3?[J]. Annals of Human Biology, 2007, 34(6): 656-663. 10.1080/03014460701732962 |
| 9 | TETLOCK P C. Giving content to investor sentiment: the role of media in the stock market[J]. The Journal of Finance, 2007, 62(3): 1139-1168. 10.1111/j.1540-6261.2007.01232.x |
| 10 | BARBER B M, ODEAN T. All that glitters: the effect of attention and news on the buying behavior of individual and institutional investors[J]. The Review of Financial Studies, 2008, 21(2): 785-818. 10.1093/rfs/hhm079 |
| 11 | ATKINS A, NIRANJAN M, GERDING E. Financial news predicts stock market volatility better than close price[J]. The Journal of Finance and Data Science, 2018, 4(2): 120-137. 10.1016/j.jfds.2018.02.002 |
| 12 | WEI Y C, LU Y C, CHEN J N, et al. Informativeness of the market news sentiment in the Taiwan stock market[J]. The North American Journal of Economics and Finance, 2017, 39: 158-181. 10.1016/j.najef.2016.10.004 |
| 13 | SIMON H A. Designing organizations for an information-rich world[J]. International Library of Critical Writings in Economics, 1996, 70: 187-202. |
| 14 | CHAN W S. Stock price reaction to news and no-news: drift and reversal after headlines[J]. Journal of Financial Economics, 2003, 70(2): 223-260. 10.1016/s0304-405x(03)00146-6 |
| 15 | 王晓丹,尚维,汪寿阳. 互联网新闻媒体报道对我国股市的影响分析[J]. 系统工程理论与实践, 2019, 39(12):3038-3047. 10.12011/1000-6788-2017-0445-10 |
| WANG X D, SHANG W, WANG S Y. The effects of online news on the Chinese stock market[J]. System Engineering — Theory and Practice, 2019, 39(12):3038-3047. 10.12011/1000-6788-2017-0445-10 | |
| 16 | LIU J, LU Z C, DU W. Combining enterprise knowledge graph and news sentiment analysis for stock price prediction[C/OL]// Proceedings of the 52nd Hawaii International Conference on System Sciences. [2021-07-02].. 10.24251/hicss.2019.153 |
| 17 | THAKKAR A, CHAUDHARI K. Fusion in stock market prediction: a decade survey on the necessity, recent developments, and potential future directions[J]. Information Fusion, 2021, 65: 95-107. 10.1016/j.inffus.2020.08.019 |
| 18 | ZHANG X, ZHANG Y J, WANG S Z, et al. Improving stock market prediction via heterogeneous information fusion[J]. Knowledge-Based Systems, 2018, 143: 236-247. 10.1016/j.knosys.2017.12.025 |
| 19 | KIM T, KIM H Y. Forecasting stock prices with a feature fusion LSTM-CNN model using different representations of the same data[J]. PLoS ONE, 2019, 14(2): No.e0212320. 10.1371/journal.pone.0212320 |
| 20 | HASSAN M R, NATH B, KIRLEY M. A fusion model of HMM, ANN and GA for stock market forecasting[J]. Expert Systems with Applications, 2007, 33(1): 171-180. 10.1016/j.eswa.2006.04.007 |
| 21 | ZHANG Q, YANG L J, ZHOU F. Attention enhanced long short-term memory network with multi-source heterogeneous information fusion: an application to BGI Genomics[J]. Information Sciences, 2021, 553: 305-330. 10.1016/j.ins.2020.10.023 |
| 22 | PATEL J, SHAH S, THAKKAR P, et al. Predicting stock market index using fusion of machine learning techniques[J]. Expert Systems with Applications, 2015, 42(4): 2162-2172. 10.1016/j.eswa.2014.10.031 |
| 23 | 李晓寒,贾华丁,程雪,等. 基于改进遗传算法和图神经网络的股市波动预测方法[J/OL]. 计算机应用. (2021-08-17) [2021-08-20].. |
| LI X H, JIA H D, CHENG X, et al. Stock market fluctuation prediction method based on improved genetic algorithm and graph neural network[J/OL]. Journal of Computer Applications. (2021-08-17) [2021-08-20].. | |
| 24 | KAHNEMAN D, TVERSKY A. On the interpretation of intuitive probability: a reply to Jonathan Cohen[J]. Cognition, 1979, 7(4): 409-411. 10.1016/0010-0277(79)90024-6 |
| 25 | LO A W, MacKINLAY A C. Stock market prices do not follow random walks: evidence from a simple specification test[J]. The Review of Financial Studies, 1988, 1(1): 41-66. 10.1093/rfs/1.1.41 |
| 26 | TANG H, CHIU K C, XU L. Finite mixture of ARMA-GARCH model for stock price prediction[C/OL]// Proceedings of the 3rd International Workshop on Computational Intelligence in Economics and Finance. [2018-10-10].. |
| 27 | ROJAS I, VALENZUELA O, ROJAS F, et al. Soft-computing techniques and ARMA model for time series prediction[J]. Neurocomputing, 2008, 71(4/5/6): 519-537. 10.1016/j.neucom.2007.07.018 |
| 28 | JEGADEESH N, TITMAN S. Returns to buying winners and selling losers: implications for stock market efficiency[J]. The Journal of Finance, 1993, 48(1): 65-91. 10.1111/j.1540-6261.1993.tb04702.x |
| 29 | FAMA E F, FRENCH K R. The cross-section of expected stock returns[J]. The Journal of Finance, 1992, 47(2):427-465. 10.1111/j.1540-6261.1992.tb04398.x |
| 30 | FAMA E F, FRENCH F K R. Multifactor explanations of asset pricing anomalies[J]. The Journal of Finance, 1996, 51(1):55-84. 10.1111/j.1540-6261.1996.tb05202.x |
| 31 | SI J F, MUKHERJEE A, LIU B, et al. Exploiting topic based twitter sentiment for stock prediction[C]// Proceedings of the 51st Annual Meeting of the Association for Computational Linguistics (Volume 2: Short Papers). Stroudsburg, PA: Association for Computational Linguistics, 2013: 24-29. |
| 32 | DING X, ZHANG Y, LIU T, et al. Deep learning for event-driven stock prediction[C]// Proceedings of the 24th International Joint Conference on Artificial Intelligence. Palo Alto, CA: AAAI Press, 2015: 2327-2333. |
| 33 | DING X, ZHANG Y, LIU T, et al. Using structured events to predict stock price movement: an empirical investigation[C]// Proceedings of the Proceedings of the 2014 Conference on Empirical Methods in Natural Language Processing. Stroudsburg, PA: Association for Computational Linguistics, 2014: 1415-1425. 10.3115/v1/d14-1148 |
| 34 | TAN J H, WANG J, RINPRASERTMEECHAI D, et al. A tensor-based eLSTM model to predict stock price using financial news[C/OL]// Proceedings of the 52nd Hawaii International Conference on System Sciences. [2021-07-02].. 10.24251/hicss.2019.201 |
| 35 | CHAI L, XU H F, LUO Z M, et al. A multi-source heterogeneous data analytic method for future price fluctuation prediction[J]. Neurocomputing, 2020, 418: 11-20. 10.1016/j.neucom.2020.07.073 |
| 36 | ZHANG X, LI Y X, WANG S Z, et al. Enhancing stock market prediction with extended coupled hidden Markov model over multi-sourced data[J]. Knowledge and Information Systems, 2019, 61(2): 1071-1090. 10.1007/s10115-018-1315-6 |
| 37 | KIM R, SO C H, JEONG M, et al. HATS: a hierarchical graph attention network for stock movement prediction[EB/OL]. (2019-11-12) [2021-06-20].. |
| 38 | LI Q, WANG J, WANG F, et al. The role of social sentiment in stock markets: a view from joint effects of multiple information sources[J]. Multimedia Tools and Applications, 2017, 76(10): 12315-12345. 10.1007/s11042-016-3643-4 |
| 39 | 呼延康,樊鑫,余乐天,等. 图神经网络回归的人脸超分辨率重建[J]. 软件学报, 2018, 29(4):914-925. |
| HUYAN K, FAN X, YU L T, et al. Graph based neural network regression strategy for facial image super-resolution[J]. Journal of Software, 2018, 29(4):914-925. | |
| 40 | KIM K-J, HAN I. Genetic algorithms approach to feature discretization in artificial neural networks for the prediction of stock price index[J]. Expert Systems with Applications, 2000, 19(2): 125-132. 10.1016/s0957-4174(00)00027-0 |
| 41 | LI Q, JIANG L L, LI P, et al. Tensor-based learning for predicting stock movements[C]// Proceedings of 29th AAAI Conference on Artificial Intelligence. Palo Alto, CA: AAAI Press, 2015:1784-1790. 10.1609/aaai.v29i1.9452 |
| 42 | BRUNA J, ZAREMBA W, SZLAM A, et al. Spectral networks and locally connected networks on graphs[EB/OL]. (2014-05-21) [2021-06-20].. |
| 43 | DEFFERRARD M, BRESSON X, VANDERGHEYNST P. Convolutional neural networks on graphs with fast localized spectral filtering[C]// Proceedings of the 30th International Conference on Neural Information Processing Systems. Red Hook, NY: Curran Associates Inc., 2016: 3844-3852. |
| 44 | KIPF T N, WELLING M. Semi-supervised classification with graph convolutional networks[EB/OL]. (2017-02-22) [2021-06-20].. |
| 45 | LIU Y, ZENG Q G, YANG H R, et al. Stock price movement prediction from financial news with deep learning and knowledge graph embedding[C]// Proceedings of the 2018 Pacific Rim Knowledge Acquisition Workshop, LNCS 11016. Cham: Springer, 2018: 102-113. |
| 46 | MATSUNAGA D, SUZUMURA T, TAKAHASHI T. Exploring graph neural networks for stock market predictions with rolling window analysis[EB/OL]. (2019-11-27) [2021-06-20].. |
| 47 | HUANG T L. The puzzling media effect in the Chinese stock market[J]. Pacific-Basin Finance Journal, 2018, 49: 129-146. 10.1016/j.pacfin.2018.04.005 |
| 48 | ARASU A, WIDOM J. Resource sharing in continuous sliding-window aggregates[C]// Proceedings of the 30th International Conference on Very Large Data Bases. [S.l.]: VLDB Endowment, 2004: 336-347. 10.1016/b978-012088469-8.50032-2 |
| [1] | 杨航, 李汪根, 张根生, 王志格, 开新. 基于图神经网络的多层信息交互融合算法用于会话推荐[J]. 《计算机应用》唯一官方网站, 2024, 44(9): 2719-2725. |
| [2] | 杨兴耀, 陈羽, 于炯, 张祖莲, 陈嘉颖, 王东晓. 结合自我特征和对比学习的推荐模型[J]. 《计算机应用》唯一官方网站, 2024, 44(9): 2704-2710. |
| [3] | 杜郁, 朱焱. 构建预训练动态图神经网络预测学术合作行为消失[J]. 《计算机应用》唯一官方网站, 2024, 44(9): 2726-2731. |
| [4] | 唐廷杰, 黄佳进, 秦进. 基于图辅助学习的会话推荐[J]. 《计算机应用》唯一官方网站, 2024, 44(9): 2711-2718. |
| [5] | 杨莹, 郝晓燕, 于丹, 马垚, 陈永乐. 面向图神经网络模型提取攻击的图数据生成方法[J]. 《计算机应用》唯一官方网站, 2024, 44(8): 2483-2492. |
| [6] | 杨帆, 邹窈, 朱明志, 马振伟, 程大伟, 蒋昌俊. 基于图注意力Transformer神经网络的信用卡欺诈检测模型[J]. 《计算机应用》唯一官方网站, 2024, 44(8): 2634-2642. |
| [7] | 董瑶, 付怡雪, 董永峰, 史进, 陈晨. 不完整多视图聚类综述[J]. 《计算机应用》唯一官方网站, 2024, 44(6): 1673-1682. |
| [8] | 林欣蕊, 王晓菲, 朱焱. 基于局部扩展社区发现的学术异常引用群体检测[J]. 《计算机应用》唯一官方网站, 2024, 44(6): 1855-1861. |
| [9] | 汪炅, 唐韬韬, 贾彩燕. 无负采样的正样本增强图对比学习推荐方法PAGCL[J]. 《计算机应用》唯一官方网站, 2024, 44(5): 1485-1492. |
| [10] | 郭洁, 林佳瑜, 梁祖红, 罗孝波, 孙海涛. 基于知识感知和跨层次对比学习的推荐方法[J]. 《计算机应用》唯一官方网站, 2024, 44(4): 1121-1127. |
| [11] | 徐大鹏, 侯新民. 基于网络结构设计的图神经网络特征选择方法[J]. 《计算机应用》唯一官方网站, 2024, 44(3): 663-670. |
| [12] | 胡能兵, 蔡彪, 李旭, 曹旦华. 基于图池化对比学习的图分类方法[J]. 《计算机应用》唯一官方网站, 2024, 44(11): 3327-3334. |
| [13] | 花晓雨, 李冬芬, 付优, 毕可骏, 应时, 王瑞锦. 结合层次图神经网络与长短期记忆的产业链风险评估预警模型[J]. 《计算机应用》唯一官方网站, 2024, 44(10): 3223-3231. |
| [14] | 周北京, 王海荣, 王怡梦, 张丽丝, 马赫. 图谱嵌入传播的推荐方法[J]. 《计算机应用》唯一官方网站, 2024, 44(10): 3252-3259. |
| [15] | 罗俊豪, 朱焱. 用于未对齐多模态语言序列情感分析的多交互感知网络[J]. 《计算机应用》唯一官方网站, 2024, 44(1): 79-85. |
| 阅读次数 | ||||||
|
全文 |
|
|||||
|
摘要 |
|
|||||