


《计算机应用》唯一官方网站 ›› 2024, Vol. 44 ›› Issue (4): 1099-1106.DOI: 10.11772/j.issn.1001-9081.2023050557
所属专题: 人工智能
李宗禹1,2, 强思维3, 郭晓波3, 朱振峰1,2( )
)
收稿日期:2023-05-10
修回日期:2023-07-18
接受日期:2023-07-24
发布日期:2023-08-03
出版日期:2024-04-10
通讯作者:
朱振峰
作者简介:李宗禹(1998—),男,河北衡水人,硕士研究生,主要研究方向:因果效应估计、因果推理基金资助:
Zongyu LI1,2, Siwei QIANG3, Xiaobo GUO3, Zhenfeng ZHU1,2()
Received:2023-05-10
Revised:2023-07-18
Accepted:2023-07-24
Online:2023-08-03
Published:2024-04-10
Contact:
Zhenfeng ZHU
About author:LI Zongyu, born in 1998, M. S. candidate. His research interests include causal effect estimation, causal inference.Supported by:摘要:
反事实预测和选择偏差是因果效应估计中的重大挑战。为对潜在协变量的复杂混杂分布进行有效表征,同时增强反事实预测泛化能力,提出一种面向工业因果效应估计应用的重加权对抗变分自编码器网络(RVAENet)模型。针对混杂分布去偏问题,借鉴域适应思想,采用对抗学习机制对由变分自编码器(VAE)获得的隐含变量进行表示学习的分布平衡;在此基础上,通过学习样本倾向性权重对样本进行重加权,进一步缩小实验组(Treatment)与对照组(Control)样本间的分布差异。实验结果表明,在工业真实场景数据集的两个场景下,所提模型的提升曲线下的面积(AUUC)比TEDVAE(Treatment Effect with Disentangled VAE)分别提升了15.02%、16.02%;在公开数据集上,所提模型的平均干预效果(ATE)和异构估计精度(PEHE)普遍取得最优结果。
中图分类号:
李宗禹, 强思维, 郭晓波, 朱振峰. 重加权的对抗变分自编码器及其在工业因果效应估计中的应用[J]. 计算机应用, 2024, 44(4): 1099-1106.
Zongyu LI, Siwei QIANG, Xiaobo GUO, Zhenfeng ZHU. Re-weighted adversarial variational autoencoder and its application in industrial causal effect estimation[J]. Journal of Computer Applications, 2024, 44(4): 1099-1106.
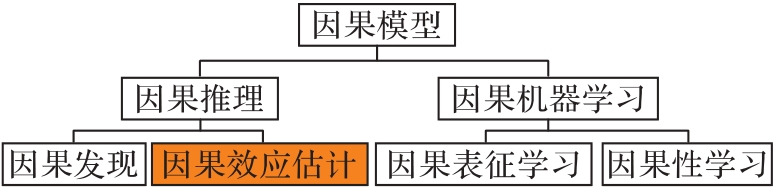
图1 因果模型分类法
Fig. 1 Taxonomy of causal models
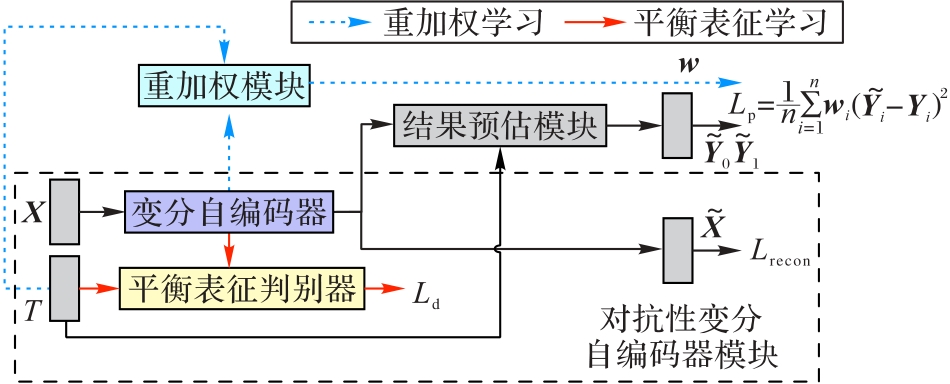
图2 RVAENet的总体结构
Fig. 2 Overall structure of RVAENet
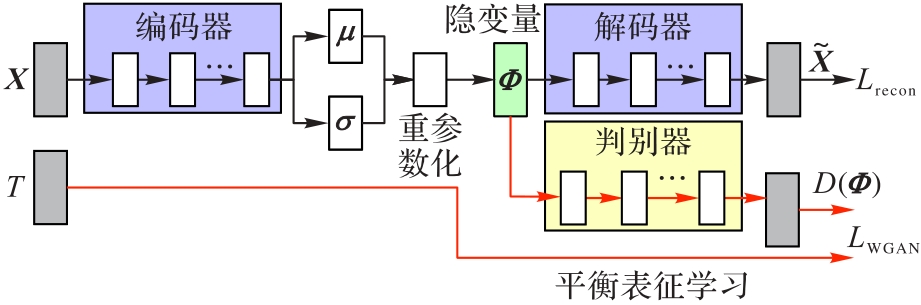
图3 对抗性VAE框架
Fig. 3 Framework of adversarial VAE
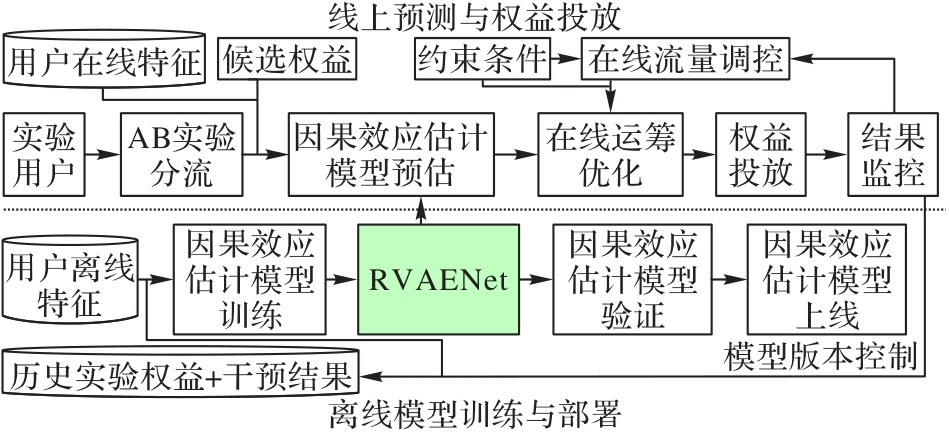
图4 权益推荐系统框架与流程
Fig. 4 Framework and flow of benefit recommendation system
| 模型 | 测试集AUUC | |
|---|---|---|
| 场景1 | 场景2 | |
| SRF[ | 0.355 3 | 0.321 8 |
| TRF[ | 0.253 1 | 0.061 9 |
| TARNet[ | 0.384 4 | 0.346 6 |
| CFRNet[ | 0.384 8 | 0.346 9 |
| WCFR[ | 0.433 1 | 0.391 5 |
| DragonNet[ | 0.384 4 | 0.348 7 |
| GANITE[ | 0.363 4 | 0.377 6 |
| CEVAE[ | 0.426 7 | 0.367 6 |
| TEDVAE[ | 0.427 3 | 0.383 8 |
| RVAENet | 0.491 5 | 0.445 3 |
表1 推荐系统工业数据集上因果效应估计的性能表现
Tab. 1 Performance of causal effect estimation on industrial dataset of recommended system
| 模型 | 测试集AUUC | |
|---|---|---|
| 场景1 | 场景2 | |
| SRF[ | 0.355 3 | 0.321 8 |
| TRF[ | 0.253 1 | 0.061 9 |
| TARNet[ | 0.384 4 | 0.346 6 |
| CFRNet[ | 0.384 8 | 0.346 9 |
| WCFR[ | 0.433 1 | 0.391 5 |
| DragonNet[ | 0.384 4 | 0.348 7 |
| GANITE[ | 0.363 4 | 0.377 6 |
| CEVAE[ | 0.426 7 | 0.367 6 |
| TEDVAE[ | 0.427 3 | 0.383 8 |
| RVAENet | 0.491 5 | 0.445 3 |
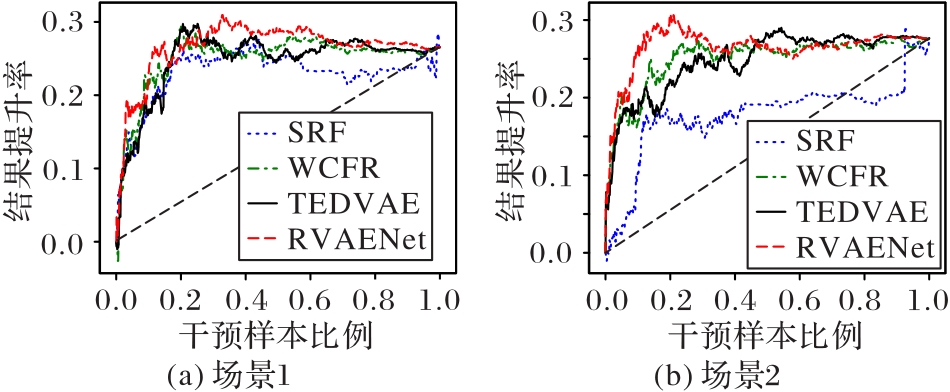
图5 场景1、2中各模型响应提升曲线
Fig. 5 Response lift curves of various models under Scenario 1 and 2
| 模型 | ||||||
|---|---|---|---|---|---|---|
| IHDP(In-sample) | IHDP(Out-sample) | Twins(In-sample) | Twins(Out-sample) | Jobs(In-sample) | Jobs(Out-sample) | |
| BNN | 2.20±0.10 | 2.10±0.10 | 0.307±0.001 | 0.309±0.004 | 0.20±0.01 | 0.24±0.02 |
| TARNet | 0.88±0.02 | 0.95±0.02 | 0.314±0.001 | 0.313±0.002 | 0.17±0.01 | 0.21±0.01 |
| CFRMMD | 0.73±0.01 | 0.78±0.02 | 0.312±0.001 | 0.316±0.003 | 0.18±0.00 | 0.21±0.01 |
| CFRWASS | 0.71±0.02 | 0.76±0.02 | 0.308±0.001 | 0.309±0.003 | 0.17±0.01 | 0.21±0.01 |
| CEVAE | 2.70±0.10 | 2.60±0.10 | 0.289±0.005 | 0.297±0.016 | 0.15±0.00 | 0.26±0.00 |
| GANITE | 1.90±0.40 | 2.40±0.40 | — | — | 0.13±0.01 | 0.14±0.01 |
| SITE | 0.60±0.09 | 0.66±0.11 | 0.309±0.002 | 0.311±0.004 | 0.22±0.00 | 0.22±0.01 |
| ACE | 0.49±0.05 | 0.54±0.06 | 0.306±0.000 | 0.301±0.002 | 0.22±0.01 | 0.22±0.01 |
| DKLITE | 0.52±0.02 | 0.65±0.03 | 0.288±0.001 | 0.293±0.003 | 0.13±0.01 | 0.14±0.01 |
| DeR-CFR | 0.44±0.02 | 0.53±0.07 | — | — | 0.19±0.04 | 0.21±0.06 |
| NESTER | 0.73±0.19 | 0.76±0.20 | 0.318±0.002 | 0.319±0.000 | — | — |
| CBRE | 0.52±0.00 | 0.60±0.10 | — | — | 0.13±0.00 | 0.28±0.00 |
| CITE | 0.58±0.10 | 0.60±0.10 | — | — | 0.23±0.02 | 0.88±0.00 |
| RVAENet | 0.45±0.04 | 0.51±0.03 | 0.291±0.002 | 0.293±0.001 | 0.13±0.01 | 0.14±0.00 |
表2 公开数据集上个体干预因果效应估计性能
Tab. 2 Performance of individual treatment effect estimation on publication datasets
| 模型 | ||||||
|---|---|---|---|---|---|---|
| IHDP(In-sample) | IHDP(Out-sample) | Twins(In-sample) | Twins(Out-sample) | Jobs(In-sample) | Jobs(Out-sample) | |
| BNN | 2.20±0.10 | 2.10±0.10 | 0.307±0.001 | 0.309±0.004 | 0.20±0.01 | 0.24±0.02 |
| TARNet | 0.88±0.02 | 0.95±0.02 | 0.314±0.001 | 0.313±0.002 | 0.17±0.01 | 0.21±0.01 |
| CFRMMD | 0.73±0.01 | 0.78±0.02 | 0.312±0.001 | 0.316±0.003 | 0.18±0.00 | 0.21±0.01 |
| CFRWASS | 0.71±0.02 | 0.76±0.02 | 0.308±0.001 | 0.309±0.003 | 0.17±0.01 | 0.21±0.01 |
| CEVAE | 2.70±0.10 | 2.60±0.10 | 0.289±0.005 | 0.297±0.016 | 0.15±0.00 | 0.26±0.00 |
| GANITE | 1.90±0.40 | 2.40±0.40 | — | — | 0.13±0.01 | 0.14±0.01 |
| SITE | 0.60±0.09 | 0.66±0.11 | 0.309±0.002 | 0.311±0.004 | 0.22±0.00 | 0.22±0.01 |
| ACE | 0.49±0.05 | 0.54±0.06 | 0.306±0.000 | 0.301±0.002 | 0.22±0.01 | 0.22±0.01 |
| DKLITE | 0.52±0.02 | 0.65±0.03 | 0.288±0.001 | 0.293±0.003 | 0.13±0.01 | 0.14±0.01 |
| DeR-CFR | 0.44±0.02 | 0.53±0.07 | — | — | 0.19±0.04 | 0.21±0.06 |
| NESTER | 0.73±0.19 | 0.76±0.20 | 0.318±0.002 | 0.319±0.000 | — | — |
| CBRE | 0.52±0.00 | 0.60±0.10 | — | — | 0.13±0.00 | 0.28±0.00 |
| CITE | 0.58±0.10 | 0.60±0.10 | — | — | 0.23±0.02 | 0.88±0.00 |
| RVAENet | 0.45±0.04 | 0.51±0.03 | 0.291±0.002 | 0.293±0.001 | 0.13±0.01 | 0.14±0.00 |
| 模型 | ||||||
|---|---|---|---|---|---|---|
| IHDP(In-sample) | IHDP(Out-sample) | Twins(In-sample) | Twins(Out-sample) | Jobs(In-sample) | Jobs(Out-sample) | |
| BNN | 0.37±0.03 | 0.42±0.03 | 0.006±0.003 | 0.020±0.007 | 0.04±0.01 | 0.09±0.04 |
| TARNet | 0.26±0.01 | 0.28±0.01 | 0.011±0.002 | 0.015±0.002 | 0.05±0.02 | 0.11±0.04 |
| CFRMMD | 0.30±0.01 | 0.31±0.01 | — | 0.04±0.01 | 0.08±0.03 | |
| CFRWASS | 0.25±0.01 | 0.27±0.01 | 0.011±0.002 | 0.028±0.003 | 0.02±0.01 | 0.09±0.03 |
| CEVAE | 0.34±0.01 | 0.46±0.02 | — | — | 0.02±0.01 | 0.03±0.01 |
| GANITE | 0.43±0.05 | 0.49±0.05 | 0.006±0.002 | 0.009±0.008 | 0.01±0.01 | 0.06±0.03 |
| DeR-CFR | 0.13±0.02 | 0.15±0.02 | — | — | 0.05±0.08 | 0.09±0.03 |
| NESTER | 0.06±0.04 | 0.09±0.07 | 0.003±0.003 | 0.063±0.003 | 0.06±0.00 | 0.02±0.01 |
| CBRE | 0.10±0.01 | 0.13±0.02 | — | — | 0.10±0.03 | 0.21±0.07 |
| CITE | 0.09±0.01 | 0.11±0.02 | — | — | 0.06±0.02 | 0.07±0.03 |
| RVAENet | 0.07±0.05 | 0.08±0.06 | 0.002±0.001 | 0.006±0.001 | 0.02±0.02 | 0.01±0.01 |
表3 公开数据集上平均干预因果效应估计性能
Tab. 3 Performance of average treatment effect estimation on publication datasets
| 模型 | ||||||
|---|---|---|---|---|---|---|
| IHDP(In-sample) | IHDP(Out-sample) | Twins(In-sample) | Twins(Out-sample) | Jobs(In-sample) | Jobs(Out-sample) | |
| BNN | 0.37±0.03 | 0.42±0.03 | 0.006±0.003 | 0.020±0.007 | 0.04±0.01 | 0.09±0.04 |
| TARNet | 0.26±0.01 | 0.28±0.01 | 0.011±0.002 | 0.015±0.002 | 0.05±0.02 | 0.11±0.04 |
| CFRMMD | 0.30±0.01 | 0.31±0.01 | — | 0.04±0.01 | 0.08±0.03 | |
| CFRWASS | 0.25±0.01 | 0.27±0.01 | 0.011±0.002 | 0.028±0.003 | 0.02±0.01 | 0.09±0.03 |
| CEVAE | 0.34±0.01 | 0.46±0.02 | — | — | 0.02±0.01 | 0.03±0.01 |
| GANITE | 0.43±0.05 | 0.49±0.05 | 0.006±0.002 | 0.009±0.008 | 0.01±0.01 | 0.06±0.03 |
| DeR-CFR | 0.13±0.02 | 0.15±0.02 | — | — | 0.05±0.08 | 0.09±0.03 |
| NESTER | 0.06±0.04 | 0.09±0.07 | 0.003±0.003 | 0.063±0.003 | 0.06±0.00 | 0.02±0.01 |
| CBRE | 0.10±0.01 | 0.13±0.02 | — | — | 0.10±0.03 | 0.21±0.07 |
| CITE | 0.09±0.01 | 0.11±0.02 | — | — | 0.06±0.02 | 0.07±0.03 |
| RVAENet | 0.07±0.05 | 0.08±0.06 | 0.002±0.001 | 0.006±0.001 | 0.02±0.02 | 0.01±0.01 |
| 消融网络 | ||||||
|---|---|---|---|---|---|---|
| IHDP(In-sample) | IHDP(Out-sample) | Jobs(In-sample) | Jobs(Out-sample) | Twins(In-sample) | Twins(Out-sample) | |
| AENet | 0.51±0.03 | 0.54±0.02 | 0.16±0.04 | 0.20±0.02 | 0.315±0.008 | 0.320±0.006 |
| VAENet | 0.49±0.05 | 0.52±0.03 | 0.15±0.02 | 0.15±0.03 | 0.301±0.001 | 0.303±0.002 |
| IPWNet | 0.53±0.04 | 0.59±0.03 | 0.17±0.03 | 0.19±0.02 | 0.306±0.007 | 0.308±0.005 |
| AIPWNet | 0.52±0.05 | 0.56±0.02 | 0.16±0.04 | 0.17±0.04 | 0.305±0.003 | 0.306±0.004 |
| CBPSNet | 0.54±0.03 | 0.57±0.04 | 0.16±0.04 | 0.18±0.04 | 0.312±0.007 | 0.313±0.009 |
| RVAENet | 0.45±0.04 | 0.51±0.03 | 0.13±0.01 | 0.14±0.00 | 0.291±0.002 | 0.293±0.001 |
表4 模块化因果效应估计量化评估
Tab. 4 Quantitative evaluation of modularized causal effect estimation
| 消融网络 | ||||||
|---|---|---|---|---|---|---|
| IHDP(In-sample) | IHDP(Out-sample) | Jobs(In-sample) | Jobs(Out-sample) | Twins(In-sample) | Twins(Out-sample) | |
| AENet | 0.51±0.03 | 0.54±0.02 | 0.16±0.04 | 0.20±0.02 | 0.315±0.008 | 0.320±0.006 |
| VAENet | 0.49±0.05 | 0.52±0.03 | 0.15±0.02 | 0.15±0.03 | 0.301±0.001 | 0.303±0.002 |
| IPWNet | 0.53±0.04 | 0.59±0.03 | 0.17±0.03 | 0.19±0.02 | 0.306±0.007 | 0.308±0.005 |
| AIPWNet | 0.52±0.05 | 0.56±0.02 | 0.16±0.04 | 0.17±0.04 | 0.305±0.003 | 0.306±0.004 |
| CBPSNet | 0.54±0.03 | 0.57±0.04 | 0.16±0.04 | 0.18±0.04 | 0.312±0.007 | 0.313±0.009 |
| RVAENet | 0.45±0.04 | 0.51±0.03 | 0.13±0.01 | 0.14±0.00 | 0.291±0.002 | 0.293±0.001 |
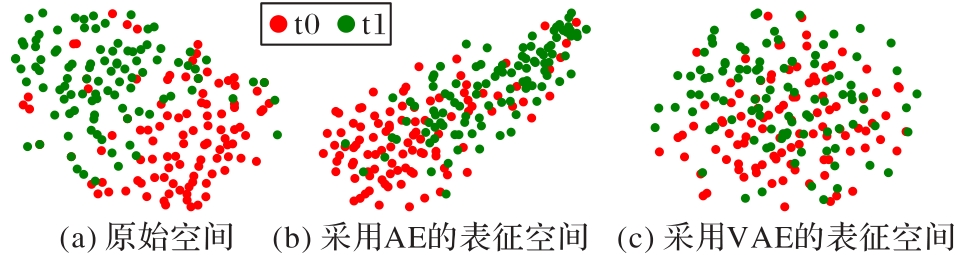
图6 IHDP数据集上AE与VAE表示空间分布可视化对比
Fig. 6 Visualization comparison of embedding space distribution between AE and VAE on IHDP dataset
| IHDP(In-sample) | IHDP(Out-sample) | Jobs(In-sample) | Jobs(Out-sample) | Twins(In-sample) | Twins(Out-sample) | |||
|---|---|---|---|---|---|---|---|---|
| 5 | 1 | 1 | 0.47±0.05 | 0.52±0.04 | 0.15±0.01 | 0.14±0.01 | 0.302±0.005 | 0.314±0.008 |
| 5 | 1 | 2 | 0.51±0.03 | 0.56±0.02 | 0.13±0.03 | 0.14±0.02 | 0.291±0.002 | 0.293±0.001 |
| 5 | 2 | 1 | 0.52±0.05 | 0.57±0.02 | 0.16±0.02 | 0.15±0.02 | 0.302±0.007 | 0.309±0.005 |
| 10 | 1 | 1 | 0.45±0.04 | 0.51±0.03 | 0.15±0.02 | 0.16±0.01 | 0.305±0.006 | 0.310±0.003 |
| 10 | 1 | 2 | 0.48±0.06 | 0.53±0.05 | 0.14±0.02 | 0.15±0.03 | 0.296±0.004 | 0.297±0.004 |
| 10 | 2 | 1 | 0.46±0.03 | 0.54±0.03 | 0.13±0.01 | 0.14±0.00 | 0.299±0.004 | 0.303±0.006 |
表5 参数化调节因果效应估计量化评估
Tab. 5 Quantitative evaluation of causal effect estimation for parameterized adjustment
| IHDP(In-sample) | IHDP(Out-sample) | Jobs(In-sample) | Jobs(Out-sample) | Twins(In-sample) | Twins(Out-sample) | |||
|---|---|---|---|---|---|---|---|---|
| 5 | 1 | 1 | 0.47±0.05 | 0.52±0.04 | 0.15±0.01 | 0.14±0.01 | 0.302±0.005 | 0.314±0.008 |
| 5 | 1 | 2 | 0.51±0.03 | 0.56±0.02 | 0.13±0.03 | 0.14±0.02 | 0.291±0.002 | 0.293±0.001 |
| 5 | 2 | 1 | 0.52±0.05 | 0.57±0.02 | 0.16±0.02 | 0.15±0.02 | 0.302±0.007 | 0.309±0.005 |
| 10 | 1 | 1 | 0.45±0.04 | 0.51±0.03 | 0.15±0.02 | 0.16±0.01 | 0.305±0.006 | 0.310±0.003 |
| 10 | 1 | 2 | 0.48±0.06 | 0.53±0.05 | 0.14±0.02 | 0.15±0.03 | 0.296±0.004 | 0.297±0.004 |
| 10 | 2 | 1 | 0.46±0.03 | 0.54±0.03 | 0.13±0.01 | 0.14±0.00 | 0.299±0.004 | 0.303±0.006 |

图7 网络训练目标函数演化曲线
Fig. 7 Evolution curve of objective function of network training
| 1 | FONG C, HAZLETT C, IMAI K. Covariate balancing propensity score for a continuous treatment: application to the efficacy of political advertisements[J]. The Annals of Applied Statistics, 2018, 12(1): 156-177. 10.1214/17-aoas1101 |
| 2 | LADA A, PEYSAKHOVICH A, APARICIO D, et al. Observational data for heterogeneous treatment effects with application to recommender systems[C]// Proceedings of the 2019 ACM Conference on Economics and Computation. New York: ACM, 2019: 199-213. 10.1145/3328526.3329558 |
| 3 | SHALIT U. Can we learn individual-level treatment policies from clinical data?[J]. Biostatistics, 2020, 21(2): 359-362. |
| 4 | NIU Y, TANG K, ZHANG H, et al. Counterfactual VQA: a cause-effect look at language bias[C]// Proceedings of the 2021 IEEE/CVF Conference on Computer Vision and Pattern Recognition. Piscataway: IEEE, 2021: 12700-12710. 10.1109/cvpr46437.2021.01251 |
| 5 | ZHAO S, HEFFERNAN N. Estimating individual treatment effect from educational studies with residual counterfactual networks[C]// Proceedings of the 10th International Conference on Educational Data Mining. [S.l.]: International Educational Data Mining Society, 2017: 306-311. |
| 6 | YAO L, CHU Z, LI S, et al. A survey on causal inference[J]. ACM Transactions on Knowledge Discovery from Data, 2021, 15(5): No. 74. 10.1145/3444944 |
| 7 | RUBIN D B. Estimating causal effects of treatments in randomized and nonrandomized studies[J]. Journal of Educational Psychology, 1974, 66(5): 688-701. 10.1037/h0037350 |
| 8 | LI Z, ZHU Z, GUO X, et al. A survey of deep causal models and their industrial applications[J/OL]. Research Square [2023-05-01]. . |
| 9 | JOHANSSON F D, SHALIT U, SONTAG D. Learning representations for counterfactual inference[C]// Proceedings of the 33rd International Conference on Machine Learning. New York: JMLR.org, 2016: 3020-3029. |
| 10 | SHALIT U, JOHANSSON F D, SONTAG D. Estimating individual treatment effect: generalization bounds and algorithms[C]// Proceedings of the 34th International Conference on Machine Learning. New York: JMLR.org, 2017: 3076-3085. 10.1007/978-1-4899-7687-1_328 |
| 11 | HASSANPOUR N, GREINER R. Counterfactual regression with importance sampling weights[C]// Proceedings of the 28th International Joint Conference on Artificial Intelligence. California: ijcai.org, 2019: 5880-5887. 10.24963/ijcai.2019/815 |
| 12 | SHI C, BLEI D M, VEITCH V. Adapting neural networks for the estimation of treatment effects[C]// Proceedings of the 33rd International Conference on Neural Information Processing Systems. Red Hook: Curran Associates Inc., 2019: 2507-2517. |
| 13 | YAO L, LI S, LI Y, et al. Representation learning for treatment effect estimation from observational data[C]// Proceedings of the 32nd International Conference on Neural Information Processing Systems. Red Hook: Curran Associates Inc., 2018: 2638-2648. 10.1109/icdm.2019.00186 |
| 14 | YAO L, LI S, LI Y, et al. ACE: adaptively similarity-preserved representation learning for individual treatment effect estimation[C]// Proceedings of the 2019 IEEE International Conference on Data Mining. Piscataway: IEEE, 2019: 1432-1437. 10.1109/icdm.2019.00186 |
| 15 | ZHANG Y, BELLOT A, VAN DER SCHAAR M. Learning overlapping representations for the estimation of individualized treatment effects[C]// Proceedings of the 23rd International Conference on Artificial Intelligence and Statistics. New York: PMLR, 2020, 108: 1005-1014. |
| 16 | LI X, YAO L. Contrastive individual treatment effects estimation[C]// Proceedings of the 2022 IEEE International Conference on Data Mining. Piscataway: IEEE, 2022: 1053-1058. 10.1109/icdm54844.2022.00130 |
| 17 | LOUIZOS C, SHALIT U, MOOIJ J M, et al. Causal effect inference with deep latent-variable models[C]// Proceedings of the 31st International Conference on Neural Information Processing Systems. Red Hook: Curran Associates Inc., 2017: 6449-6459. |
| 18 | ZHANG W, LIU L, LI J. Treatment effect estimation with disentangled latent factors[J]. Proceedings of the AAAI Conference on Artificial Intelligence, 2021, 35(12): 10923-10930. 10.1609/aaai.v35i12.17304 |
| 19 | WU A, YUAN J, KUANG K, et al. Learning decomposed representations for treatment effect estimation[J]. IEEE Transactions on Knowledge and Data Engineering, 2023, 35(5): 4989-5001. |
| 20 | YOON J, JORDON J, VAN DER SCHAAR M. GANITE: estimation of individualized treatment effects using generative adversarial nets[C/OL]// Proceedings of the 2018 International Conference on Learning Representations [2023-05-01]. . |
| 21 | ZHOU G, YAO L, XU X, et al. Cycle-balanced representation learning for counterfactual inference[C]// Proceedings of the 2022 SIAM International Conference on Data Mining. Philadelphia: SIAM, 2022: 442-450. 10.1137/1.9781611977172.50 |
| 22 | REDDY A G, BALASUBRAMANIAN V N. Estimating treatment effects using neurosymbolic program synthesis[EB/OL]. [2023-05-01]. . |
| 23 | ZHANG W, LI J, LIU L. A unified survey of treatment effect heterogeneity modelling and uplift modelling[J]. ACM Computing Surveys, 2021, 54(8): No. 162. 10.1145/3466818 |
| 24 | KUNZEL S R, SEKHON J S, BICKEL P J, et al. Metalearners for estimating heterogeneous treatment effects using machine learning[J]. Physical Sciences, 2019, 116(10): 4156-4165. 10.1073/pnas.1804597116 |
| 25 | ZHU F, LU J, LIN A, et al. Direct learning with multi-task neural networks for treatment effect estimation[J]. IEEE Transactions on Knowledge and Data Engineering, 2023, 35: 2457-2470. |
| 26 | ROSENBAUM P R, RUBIN D B. The central role of the propensity score in observational studies for causal effects[J]. Biometrika, 1983, 70(1): 41-55. 10.1093/biomet/70.1.41 |
| 27 | ROSENBAUM P R. Model-based direct adjustment[J]. Journal of the American statistical Association, 1987, 82(398): 387-394. 10.1080/01621459.1987.10478441 |
| 28 | ROBINS J M, ROTNITZKY A, ZHAO L P. Estimation of regression coefficients when some regressors are not always observed[J]. Journal of the American Statistical Association, 1994, 89(427): 846-866. 10.1080/01621459.1994.10476818 |
| 29 | IMAI K, RATKOVIC M. Covariate balancing propensity score[J]. Journal of the Royal Statistical Society Series B: Statistical Methodology, 2014, 76(1): 243-263. 10.1111/rssb.12027 |
| 30 | DEVRIENDT F, MOLDOVAN D, VERBEKE W. A literature survey and experimental evaluation of the state-of-the-art in uplift modeling: a stepping stone toward the development of prescriptive analytics[J]. Big Data, 2018, 6(1): 13-41. 10.1089/big.2017.0104 |
| 31 | BROOKS-GUNN J, LIAW F R, KLEBANOV P K. Effects of early intervention on cognitive function of low birth weight preterm infants[J]. The Journal of Pediatrics, 1992, 120(3): 350-359. 10.1016/s0022-3476(05)80896-0 |
| 32 | LaLONDE R J. Evaluating the econometric evaluations of training programs with experimental data[J]. The American Economic Review, 1986, 76: 604-620. |
| 33 | ALMOND D, CHAY K Y, LEE D S. The costs of low birth weight[J]. The Quarterly Journal of Economics, 2005, 120(3): 1031-1083. 10.1162/003355305774268228 |
| [1] | 邹博士, 杨铭, 宗辰辰, 谢明昆, 黄圣君. 基于负学习的样本重加权鲁棒学习方法[J]. 《计算机应用》唯一官方网站, 2024, 44(5): 1479-1484. |
| [2] | 黄雨鑫, 黄贻望, 黄辉. 基于浅层网络预测的元标签校正方法[J]. 《计算机应用》唯一官方网站, 2024, 44(11): 3364-3370. |
| [3] | 黄梦林, 段磊, 张袁昊, 王培妍, 李仁昊. 基于Prompt学习的无监督关系抽取模型[J]. 《计算机应用》唯一官方网站, 2023, 43(7): 2010-2016. |
| [4] | 吕新伟, 鲁淑霞. 迭代修正鲁棒极限学习机[J]. 《计算机应用》唯一官方网站, 2023, 43(5): 1342-1348. |
| [5] | 贾晴, 王来花, 王伟胜. 基于独立循环神经网络与变分自编码网络的视频帧异常检测[J]. 《计算机应用》唯一官方网站, 2023, 43(2): 507-513. |
| [6] | 蔡前舟, 郑伯川, 曾祥银, 侯金. 结合长尾数据解决方法的野生动物目标检测[J]. 《计算机应用》唯一官方网站, 2022, 42(4): 1284-1291. |
| [7] | 胡聪, 华钢. 基于注意力机制的弱监督动作定位方法[J]. 《计算机应用》唯一官方网站, 2022, 42(3): 960-967. |
| [8] | 林润超, 黄荣, 董爱华. 基于注意力机制和元特征二次重加权的小样本目标检测[J]. 《计算机应用》唯一官方网站, 2022, 42(10): 3025-3032. |
| [9] | 孙鹤立, 孙玉柱, 张晓云. 基于生成对抗网络的事件描述生成[J]. 计算机应用, 2021, 41(5): 1256-1261. |
| [10] | 陈宪聪, 潘微科, 明仲. 面向异构单类协同过滤的阶段式变分自编码器[J]. 《计算机应用》唯一官方网站, 2021, 41(12): 3499-3507. |
| [11] | 屠红艳, 张挺, 夏鹏飞, 杜奕. 基于改进型变分自编码器的不确定性空间信息重建方法[J]. 计算机应用, 2021, 41(10): 2959-2963. |
| [12] | 黄晓祥, 胡咏梅, 吴丹, 任力杰. 基于变分自编码器的异常颈动脉早期识别和预测[J]. 计算机应用, 2021, 41(10): 3082-3088. |
| 阅读次数 | ||||||
|
全文 |
|
|||||
|
摘要 |
|
|||||